With the COVID pandemic, changes occurred which exceed the scales of many of the graphs. Most of the changes were short-lived —hence the scale was not adjusted to capture the full magnitude of that short term change.
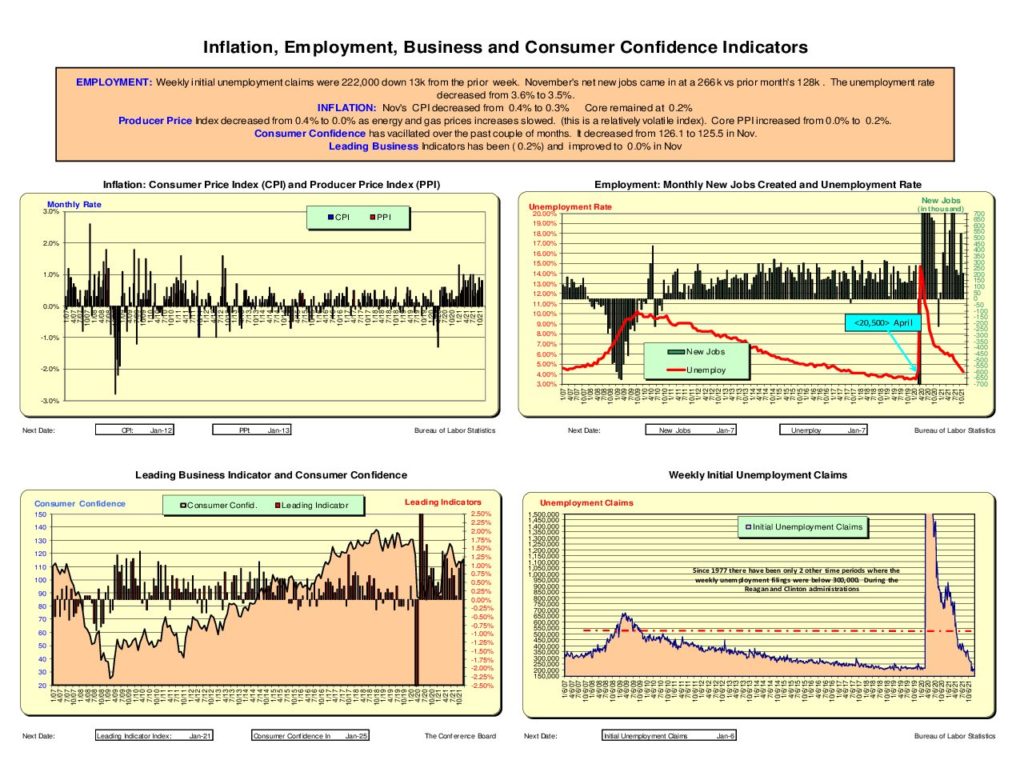
Jobs & Inflation, Consumer Confidence, and Leading Indicators
- Weekly new unemployment filings in 2020 were MUCH worse than anything in 2008 (page 1’s lower right graphic). Therefore, the Federal Reserve took drastic action. Inflation rose due to this action, some but the Feds have tools to slow it down. Disinflation is a much tougher situation to resolve—-think of the slow recovery from 2008/9.
- Consumer Confidence (lower left) is back but nowhere near the levels seen prior to March 2020 when COVID-19 hit. Consumer spending is critical to a strong economy and currently makes up 69% of the $23.3 trillion in U.S spending.
- Unemployment rate is down but is still higher than pre-COVID.
- Inflation is up but is at levels we’ve experienced in prior periods over the past 14 years.
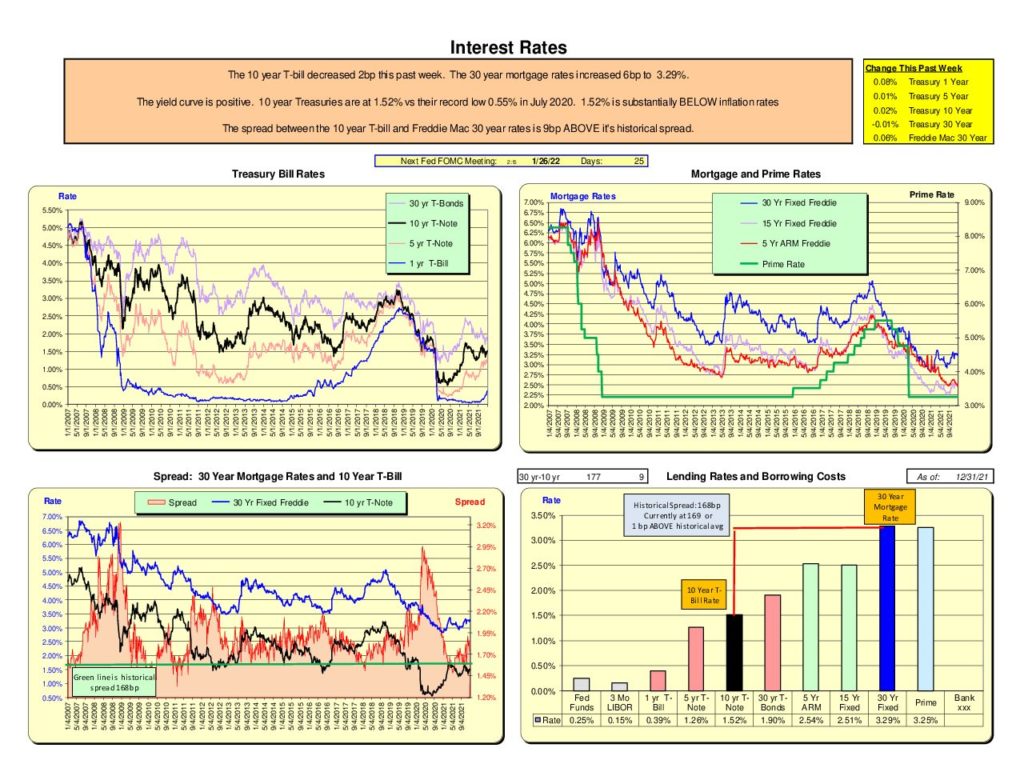
Interest Rates
- Rates remain at the lowest levels in the past 15 years, but they have risen since the low point in July 2020. The yield curve is positive.
- 30 Year Freddie Mac 30-year mortgages are 9bps higher than the spread over 10-year US Treasury rates. The 10 year is currently 1.52%. Given inflation is up, this is a concern. If one is fearful of the future, funds move to Treasury not due to return but for safety.
- 1-year Treasuries are at 39bp. If one took $100 now, invested it at 39bp, one year from now you’d have $100.39. That is BEFORE inflation. It is not about a return but safety—or—lack of other alternative investments. The Fed has signaled they will be dialing back their Taper Program which will put upward pressures on rates. Given the uncertainties of the economy, it will be a balancing act between jobs and inflation. The next Fed meeting is on Jan 26.
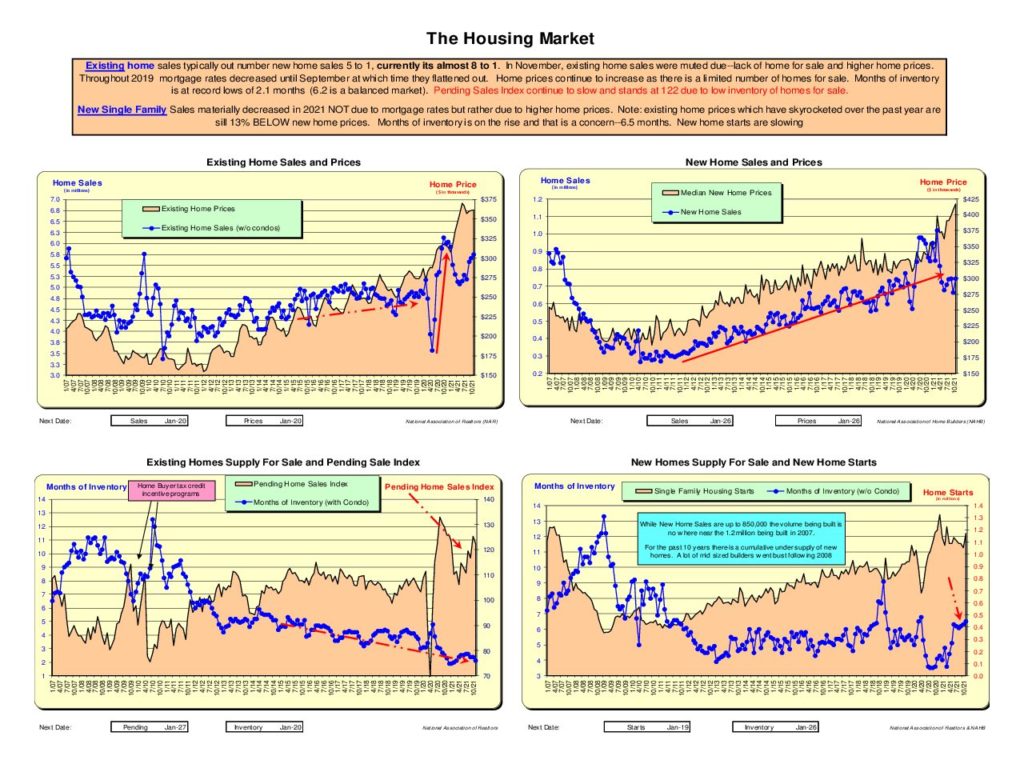
Housing
- Existing home markets continue to be hot. 8 existing homes sales occur for every new home. Normally it is
- Existing home prices are up 15% over a year ago but existing homes are 15% BELOW new home prices.
- Existing home inventory is 2 months—record low. The lack of existing home inventory is suppressing sales volume. Yes, existing home prices are up and sales volume is down but it is uncertain if the lower sales volume is due to higher prices or lack of inventory.
- It is anticipated that mortgage rates will increase in 2022. These rates are 100bp below pre-COVID levels. IF rates increase to these prior levels, it will have the effect of decreasing purchasing power by 12%
- The median sales price of NEW homes is up 24% over Nov 2020.
- New home sales are down, and months of inventory are beginning to be a concern at 7 months.
- With lower sales volume, new home starts are down slightly. Even with this decrease, home starts are at their highest level last seen in 2007.
- In Nov 2018 mortgage rates hit 5.00% and new home sales months of inventory materially spiked as sales slowed. Not to say mortgage rates are headed to this level but it appears that 5.00% is a price point for new homes sales. In a rising rate environment, this is something to keep an eye on. With mortgage rates currently at 3.28%, this is not an immediate concern, but rates do tend to rocket up and feather down.
Yes, the Fed has been active—but given where we were headed, it was needed.