How long will we have the current inflation problem? Could there be an end in sight? Clearly, Energy and to a lesser extent food are the major causes of the current inflation problem. (see the top of the graphic below). Energy prices for 12 months are up 32.9%; a worldwide event.
Inflation: 12-Month Period Ending: July 2022
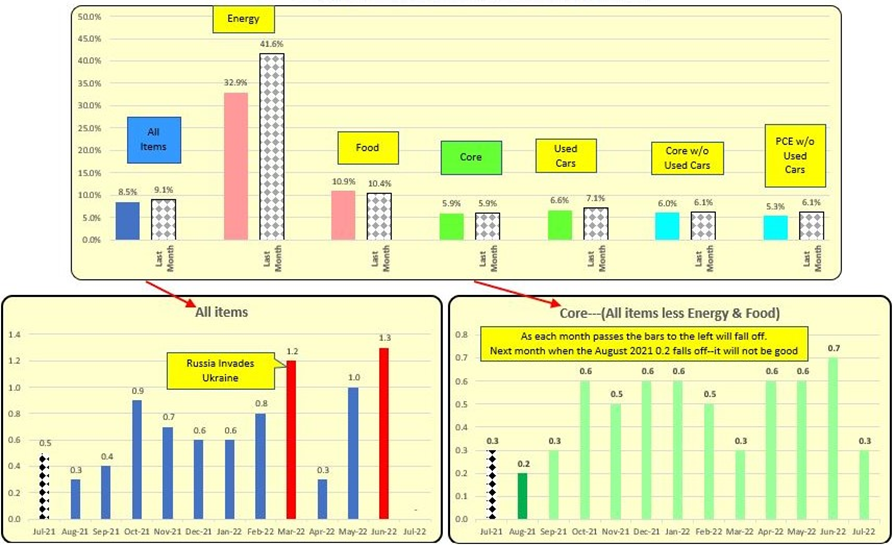
Annual inflation is 12 individual months combined. As a new month’s data is released, the oldest month’s data drops off. Think of it as being 12 dominoes, a new one comes on, every other bar shift left pushing the furthest one on the left drops off.
On the lower 2 graphs above, note the two tall red bars; it will take 8 months before the high energy costs (bars) fall off. When they do, inflation will drop off provided no further tall new bars come on. Core inflation is the lower right green bars. If we can get more than 0.3 months, it will go a long way in helping the Fed in its fight against inflation. If inflation is beat than mortgage rates come down.
Finally, how did inflation “quietly” come about? Below is an experimental graphic under development. The bars are monthly (left axis) while the red line is the 12-month rolling “average” (right axis). The public focuses on the right axis. Note two tall blue bars are March 2022 and June 2022.
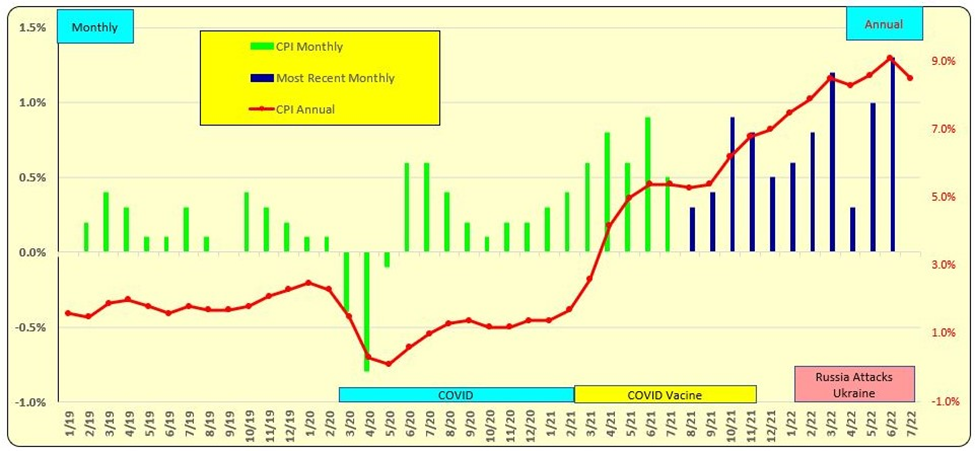
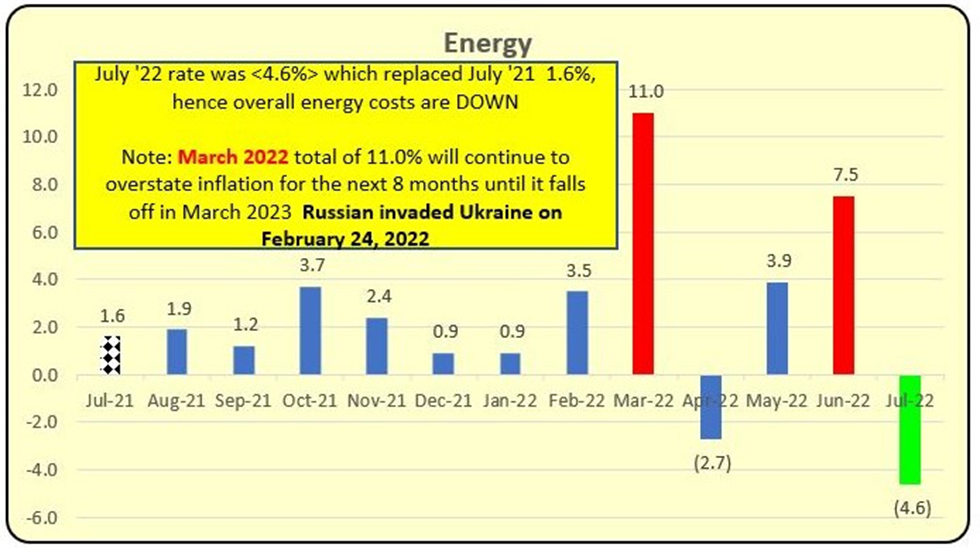
The above two tall blue bars of March 2022 and June 2022 are directly traceable to the below red bars that are in the Energy inflation category. It will take 8 months before the tall red bars (dominoes) fall off. This too shall pass but the Fed must maintain its fight against inflation to assure the bond market that it will tackle inflation. Perceptions become reality.
Bill Knudson, Research Analyst Landco ARESC