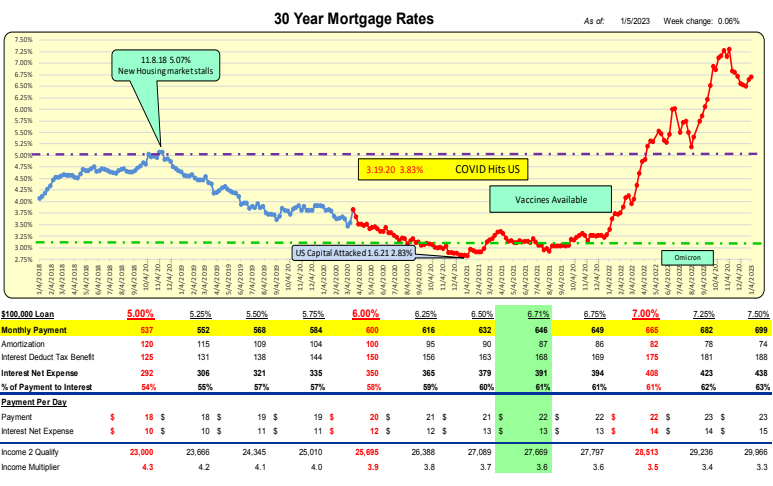
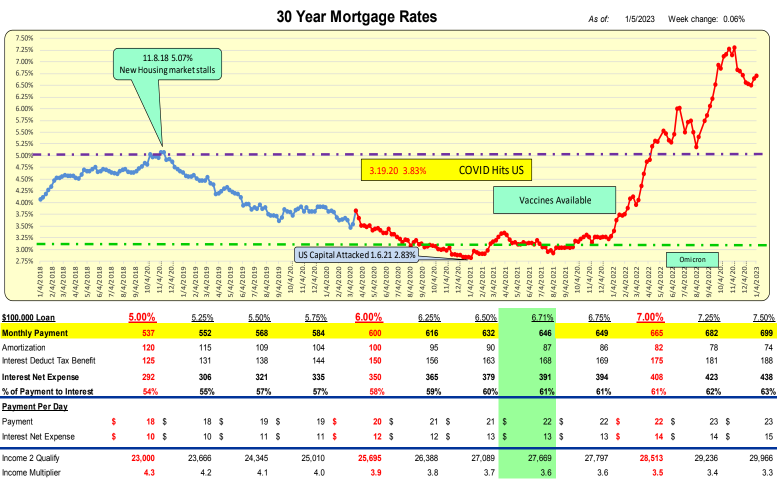
For the week ending 1.5.23 Mortgage rates INCREASED 6bp to 6.71%.
For a $100,000 loan the monthly payment INCREASED $4 to $646/mo or $.13/day.
While mortgage rates INCREASED 6bp, 10 Year Treasury rates DECREASED 12bp. The net difference resulted in an increase of 18bp in the spread to 300bp. With the historical spread being 168 there now exists a “safety cushion” of 132bp above the historical spread.
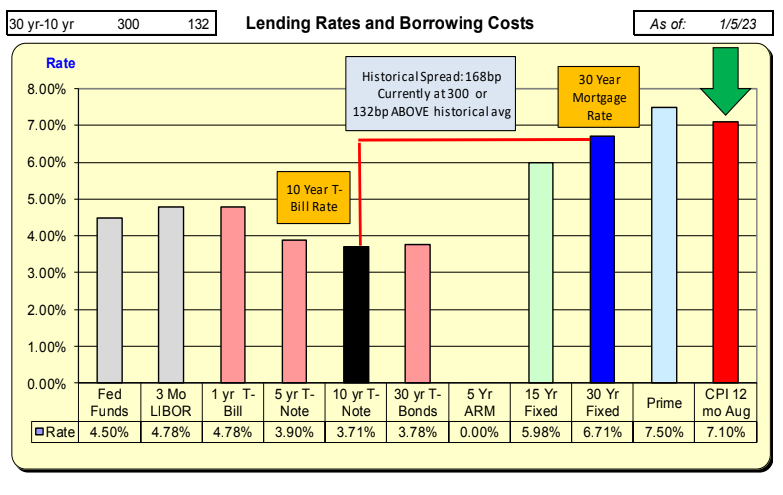
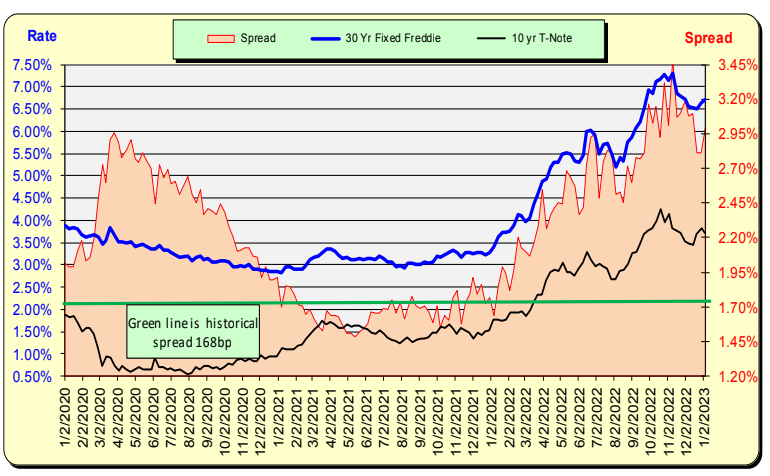
The historic spread between the 10 Year Treasury and mortgage rates is 168pb (see green line, right axis) and currently there is an 132bp above historical norm. For this spread to return to the historical norm, either mortgage rates will decrease further or 10 Year Treasury rates will increase.
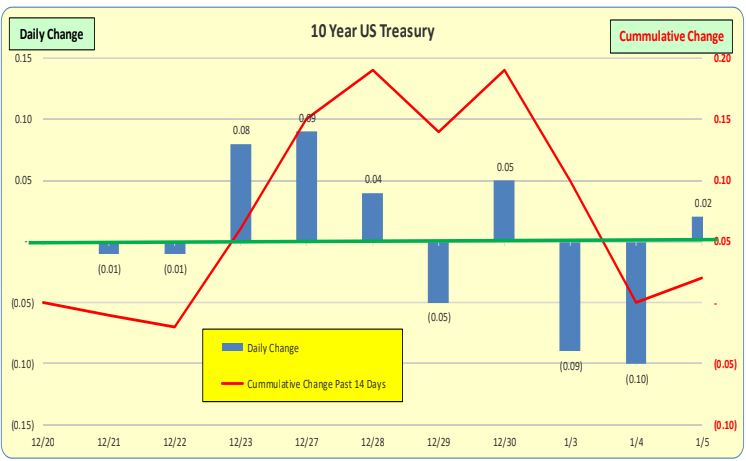
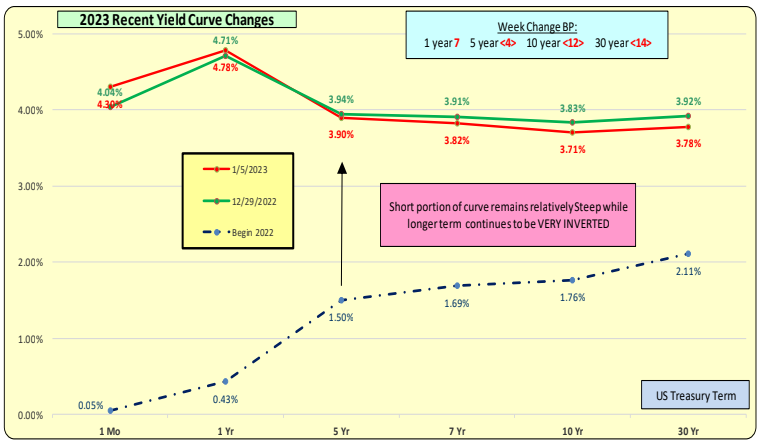
10 Year US Treasury
Daily changes in the US 10 Year Treasury rates are the blue bars while the red line is the 14 day cumulative change in rates: <1bp> cumulative DECREASE. For the blue bars it is unusual to have changes of greater than 0.10 in a single day and 0.20 is VERY unusual. 30bp is beyond rare.
Red line is most current rates while green line is one week ago.
Longer term rates were up significantly for the week. Yield curve decreased but continues to be inverted.
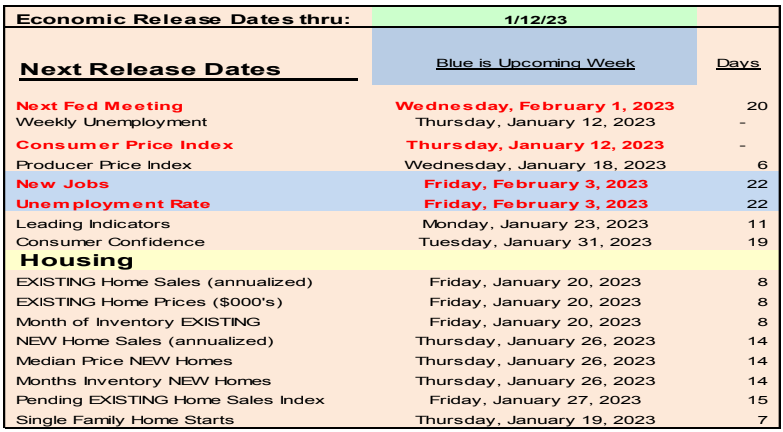
January 5 thru Jan 12, 2023—-Upcoming Week’s Data that Could Impact Treasury and Mortgage Rates
• Monthly data updates in blue
• Weekly data on Unemployment Claims–Wednesday and Mortgage rates—Thursday
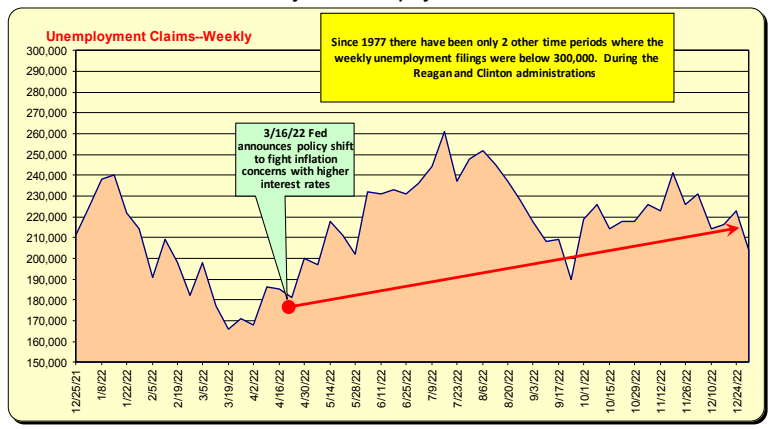
Weekly Initial Unemployment Claims
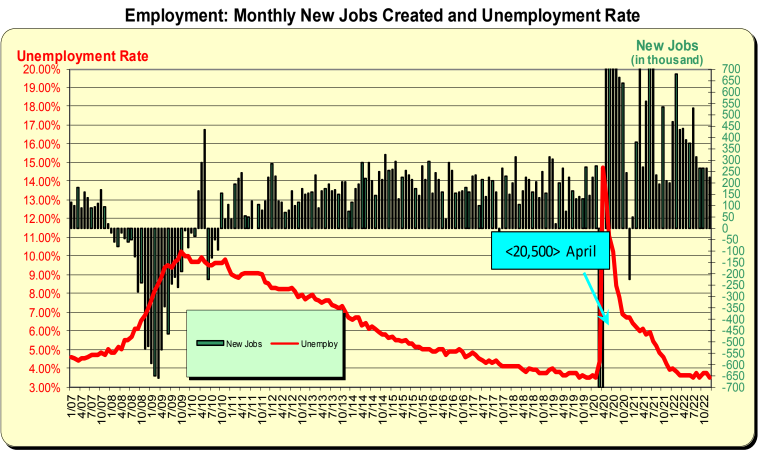
WEEKLY: Unemployment claims are available each WEDNESDAY. They have been increasing since the Fed announced their intention to increase interest rates to address inflation concerns. As the weekly claim filings increase, it will eventually slow the growth of the MONTHLY Net New Jobs total.
WEEKLY Mortgage rates are available each THURSDAY. Rates rocket up and feather down..
Monthly Net New Jobs and Unemployment Rate was released Jan 5 and included in the below graphic. 223,000 new jobs unemployment rate down to 3.5%
Bill Knudson, Research Analyst LANDCO ARESC