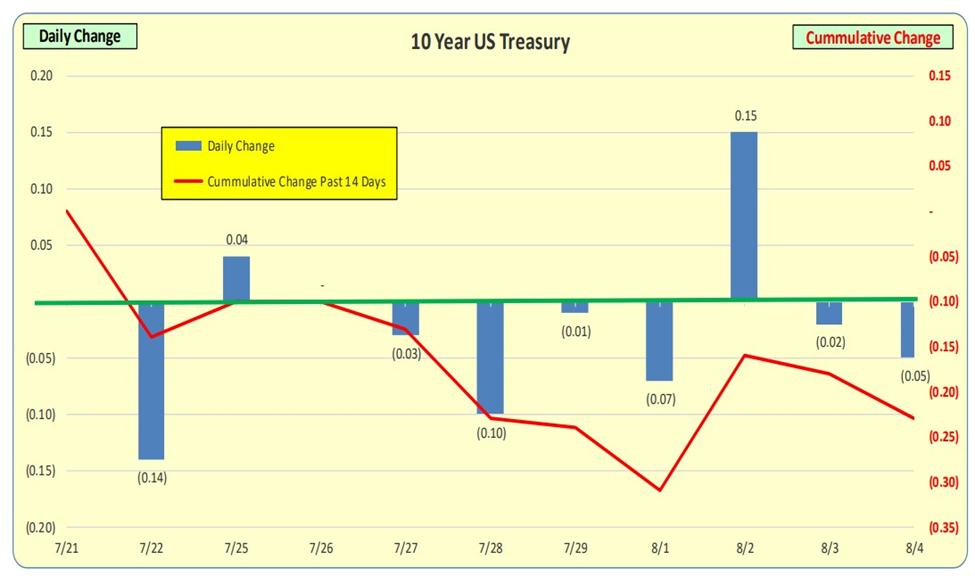
Daily changes in the US 10 Year Treasury rates are the blue bars while the red line is the 14-day cumulative change in rates: a 23 basis point decrease. For the blue bars, it is unusual to have changes of greater than 0.10 in a single day and 0.20 is VERY unusual.
10 Year Treasury Rate
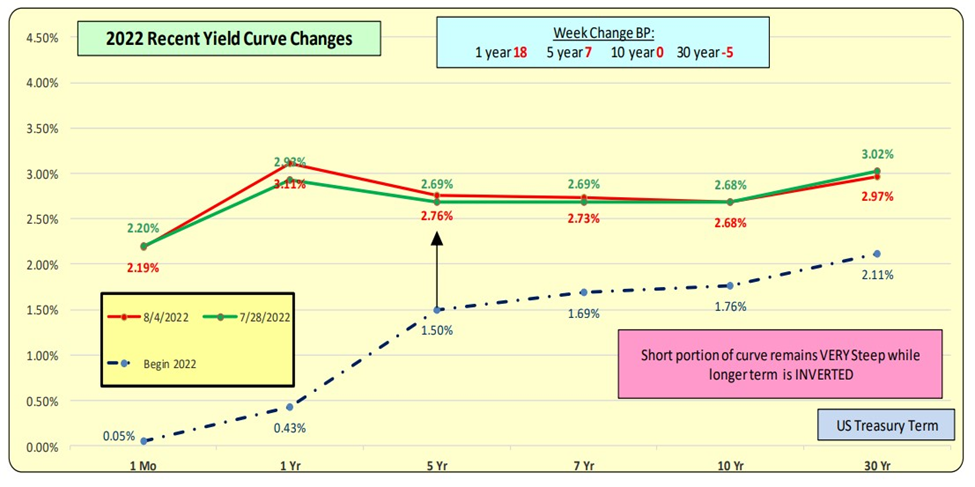
The Fed did increase the Fed Funds rates by 75 bps on July 27th. While 10-year rates were unchanged this past week, short-term 1-year rates increased by 18 bps. The Yield Curve for short term rates remain steep while the longer term (5+ years) is INVERTED. Could we be in for a short-term period of stagflation? It will take at least 12 months for the Energy Prices to “fall” out of the CPI 112-month rolling calc. In the meantime, we can have a slowing economy with higher interest rates while the Fed fights inflation. This is what an inverted yield curve is pointing to.
2022 Recent Yield Curve Changes
Bill Knudson – Research Analyst for Landco ARESC