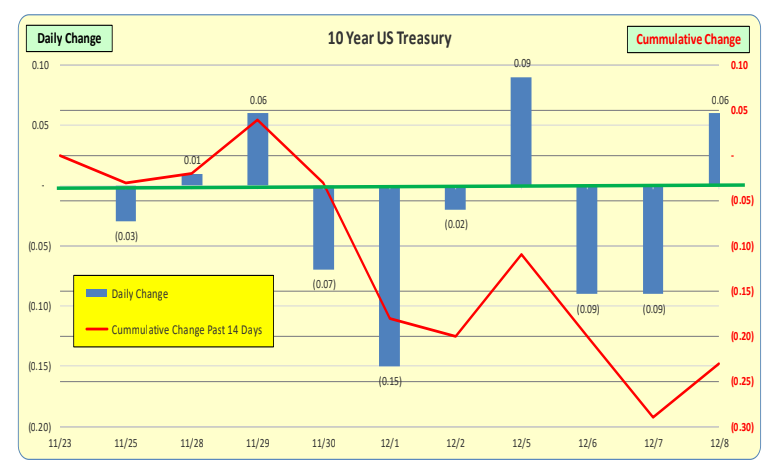
Daily changes in the US 10 Year Treasury rates are the blue bars while the red line is the 14 day cumulative change in rates: <1bp> cumulative DECREASE. For the blue bars it is unusual to have changes of greater than 0.10 in a single day and 0.20 is VERY unusual. 30bp is beyond rare.
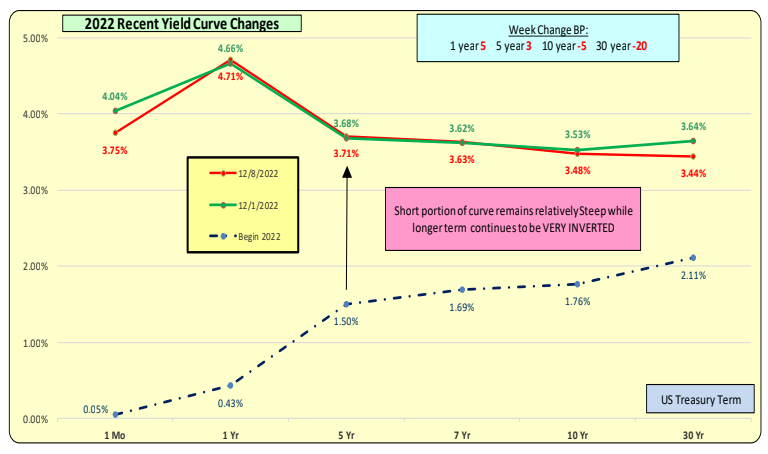
Red line is most current rates while the green line is one week ago.
One month down 29bp. Rates for 1-10 years minor changes this past week. 30 year was down 20bp. Yield curve continues to be inverted.
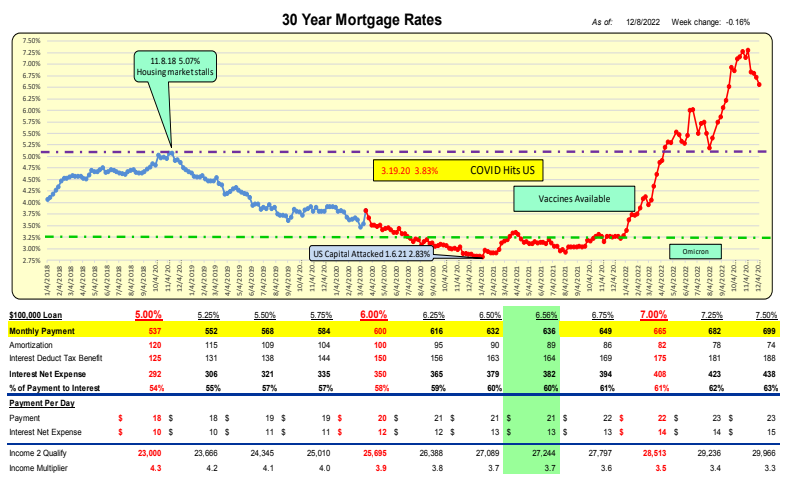
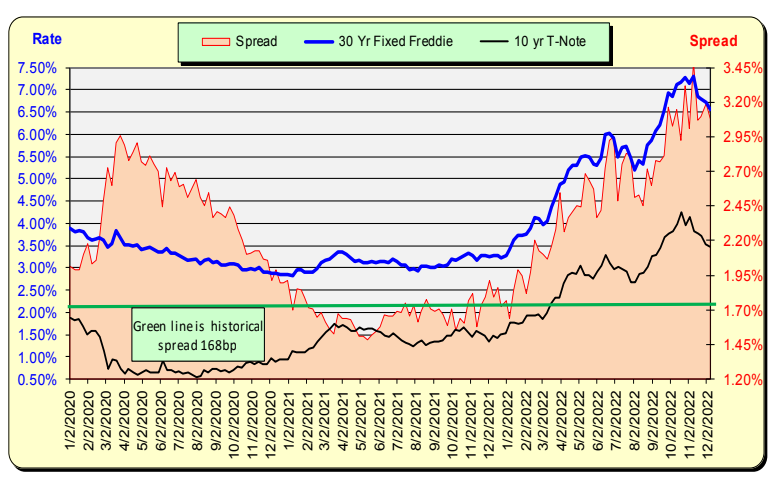
For the week ending 12.8.22 Mortgage rates DECREASED 16bp to 6.56%.
For a $100,000 loan the monthly payment DECREASED $11 to $636/mo or $.35/day.
Lending Rates and Borrowing Costs
While mortgage rates DECREASED 16bp, 10 Year Treasury rates DECREASED 5bp. The net difference is a 11bp decrease in a spread of 308bp. With the historical spread being 168 there now exists a “safety cushion” of 140bp above the historical spread.
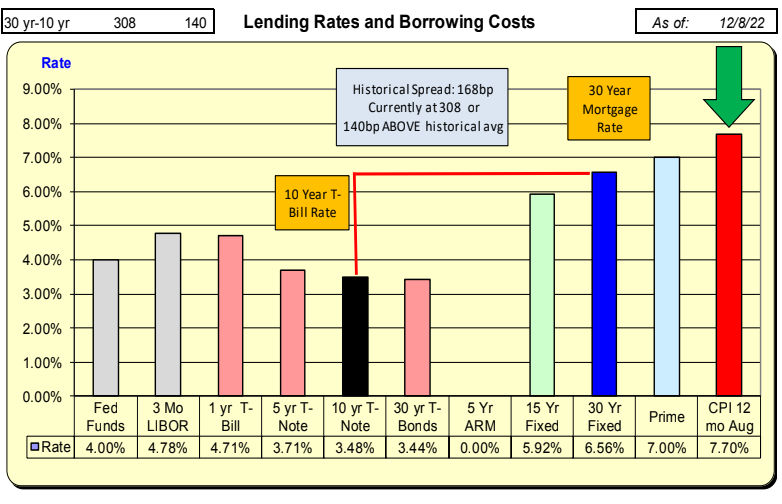
The historic spread between the 10 Year Treasury and mortgage rates is 168pb (see green line, right axis) and currently there is an 140bp above historical norm. For this spread to return to the historical norm, either mortgage rates will decrease further or 10 Year Treasury rates will increase.
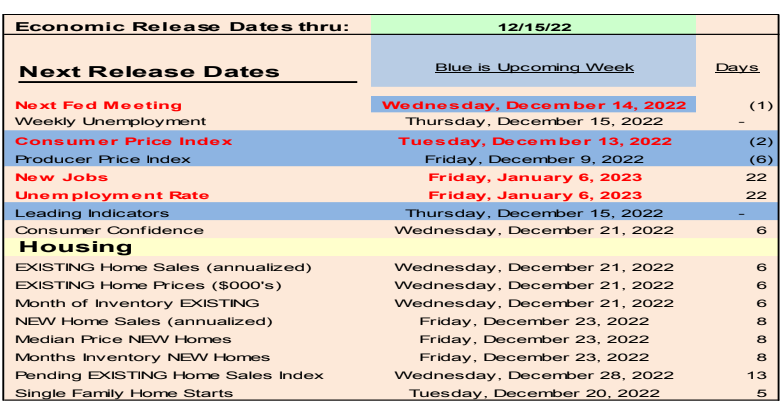
Key Econ Items in the up coming week that will impact Treasury and Mortgage Rates are high lighted in BLUE
December 8 thru Dec 15, 2022—-Upcoming Week’s Data that Could Impact Treasury and Mortgage Rates
• Federal Reserve Meets Dec 14
• Monthly data updates in blue
• Weekly data on Unemployment Claims–Wednesday and Mortgage rates—Thursday
Bill Knudson, Research Analyst Landco ARESC