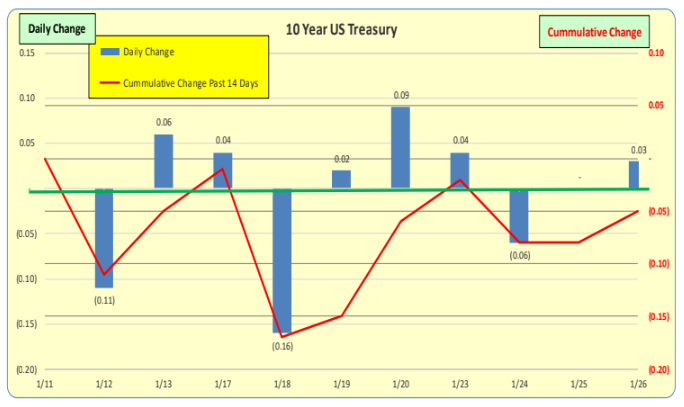
Daily changes in the US 10 Year Treasury rates are the blue bars while the red line is the 14 day cumulative change in rates: <30bp> cumulative DECREASE. For the blue bars it is unusual to have changes of greater than 0.10 in a single day and 0.20 is VERY unusual. 30bp is beyond rare.
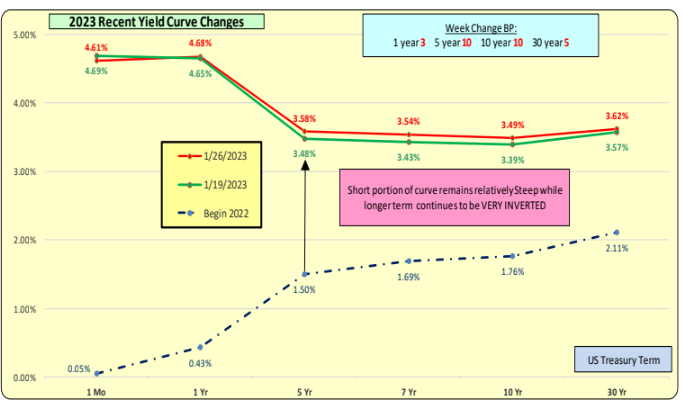
Red line is most current rates while green line is one week ago.
Longer term rates were up significantly for the week. Yield curve decreased but continues to be inverted.
January 26 thru Feb 2, 2023—-Upcoming Week’s Data that Could Impact Treasury and Mortgage Rates
• Monthly data updates in blue
• Weekly data on Unemployment Claims–Wednesday and Mortgage rates—Thursday
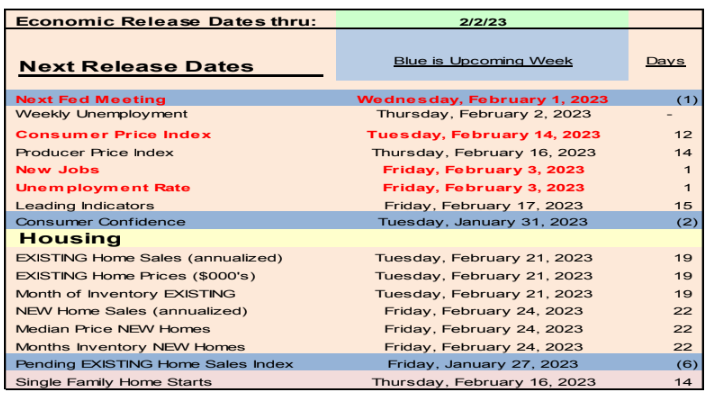
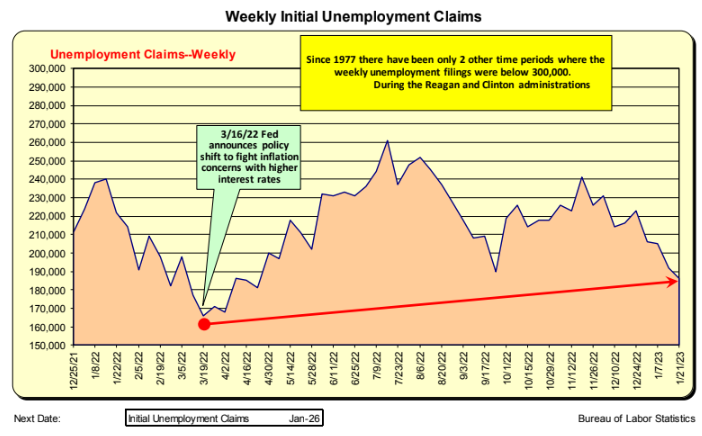
WEEKLY: Unemployment claims are available each WEDNESDAY. They have been increasing since the Fed announced their intention to increase interest rates to address inflation concerns. As the weekly claim filings increase, it will eventually slow the growth of the MONTHLY Net New Jobs total.
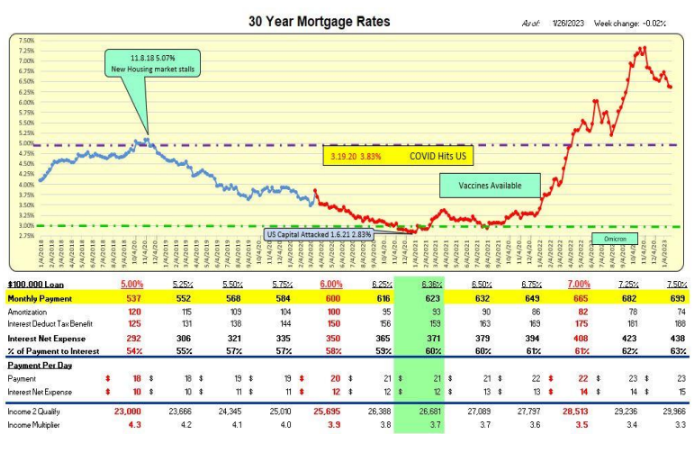
WEEKLY Mortgage rates are available each THURSDAY. Rates rocket up and feather down..
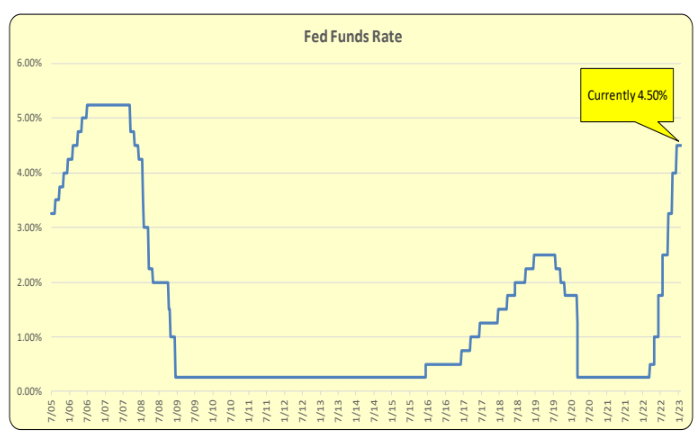
Upcoming Week: Fed Funds Rate—-Fed Meets 2.1.23
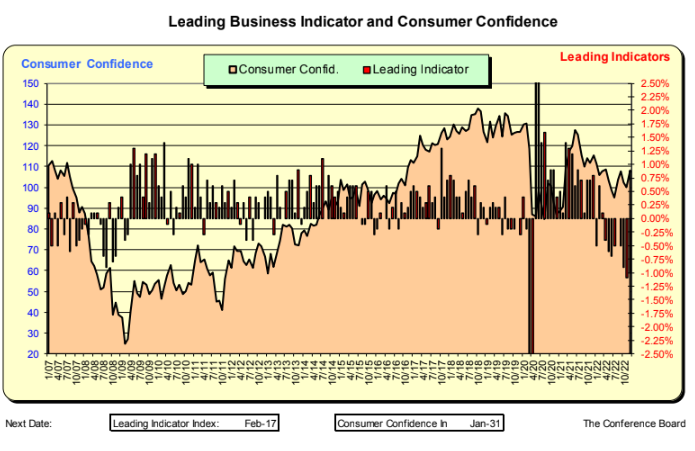
Upcoming Week: Consumer Confidence
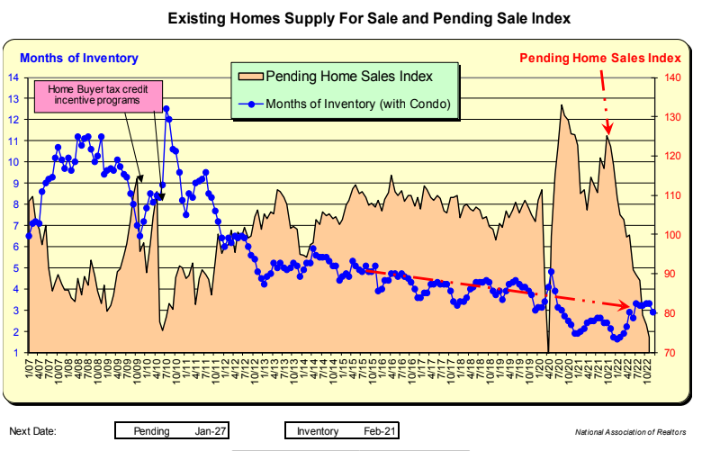
Upcoming Week: Pending Sales Index
Bill Knudson, Research Analyst LANDCO ARESC