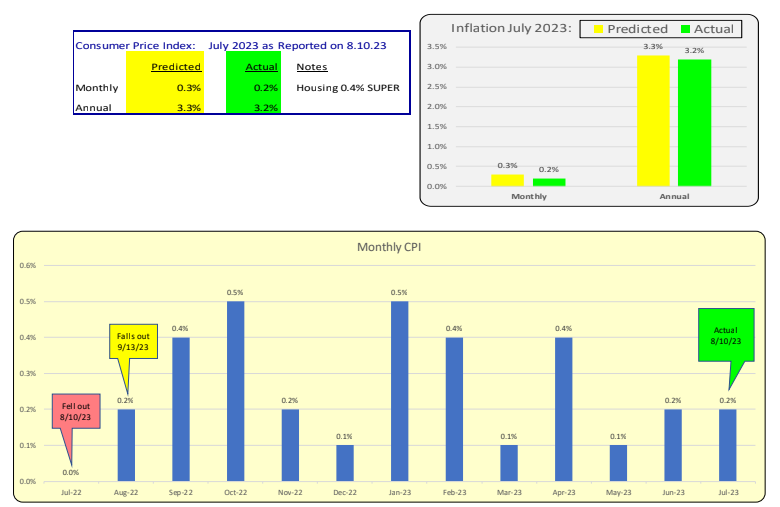
Inflation in July 2023 was reported as 8.10.23, with an annual increase from 3.0% to 3.2%.
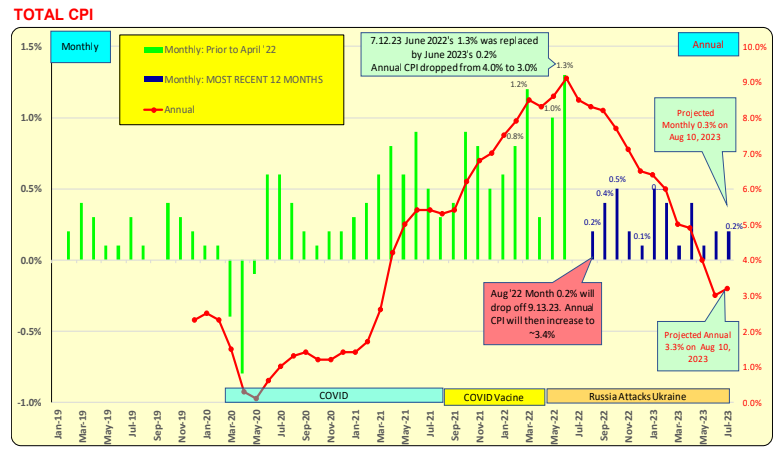
Predicted vs. Actual with a Forward Look: On 9.13.23, the CPI for August is projected to increase from 3.2% to 3.3%. July 2022, at 0.2%, falls off on 9.13.23 as August 2023 data becomes relevant and is estimated to be 0.30.
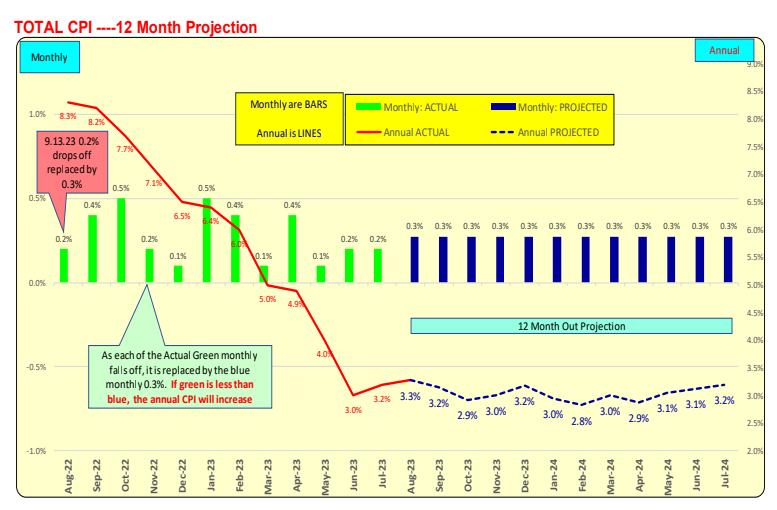
12-Month Inflation Projection: Over the past 12 months, monthly inflation has averaged 0.3%. With COVID-related supply interruptions behind us, if the 0.3% trend continues, the annual CPI is expected to range between 2.8% and 3.3%. There will be relatively minor fluctuations based on actual monthly CPI rates that are in the pipeline.
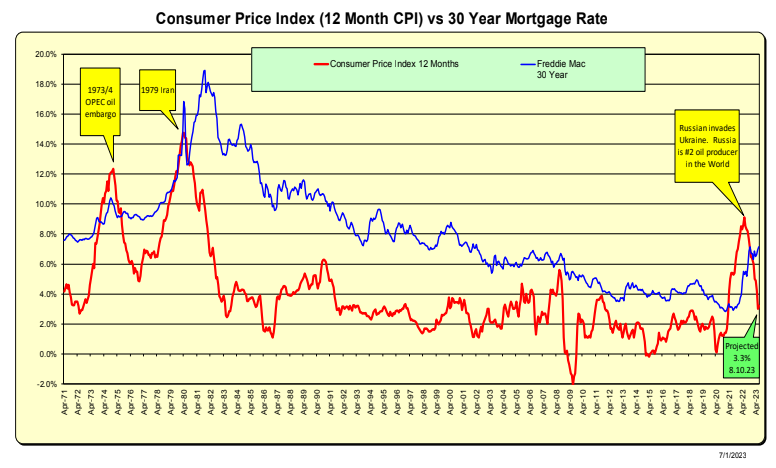
Inflation History: Over the past 50 years, the US has experienced three inflationary periods, all of which were related to oil/gas prices. It’s noteworthy that inflation spiked as rapidly as it fell off, displaying dramatic fluctuations.
It’s worth noting that mortgage rates do follow the lead of the CPI, but there is a lag time involved. Rates tend to rise rapidly and decline gradually. No one wants to be the first to lower rates in case the market slowdown persists.
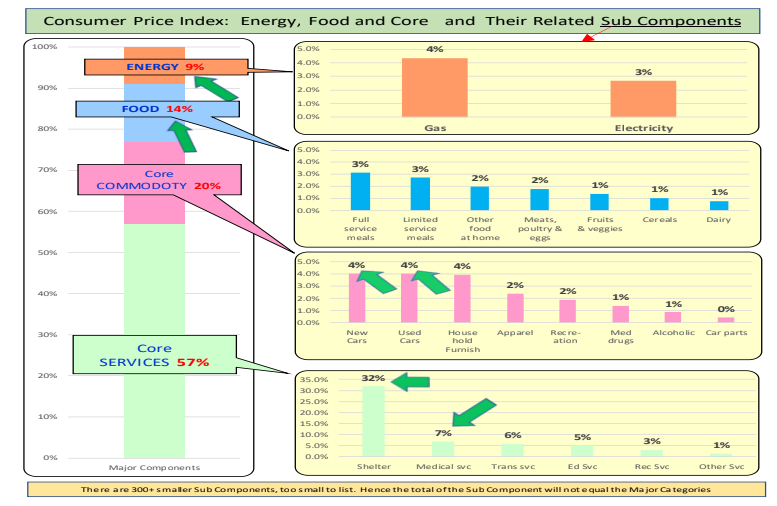
Components: Energy, Food, and Core (Commodities and Services), along with Major Subcomponents, constitute the Consumer Price Index (CPI) calculation. More than 300 product categories contribute to the CPI calculation. The 23 subcategories listed below encompass 92% of all consumer expenditures included in the CPI calculation. Green arrows account for 70% of this total and are monitored on a monthly basis.
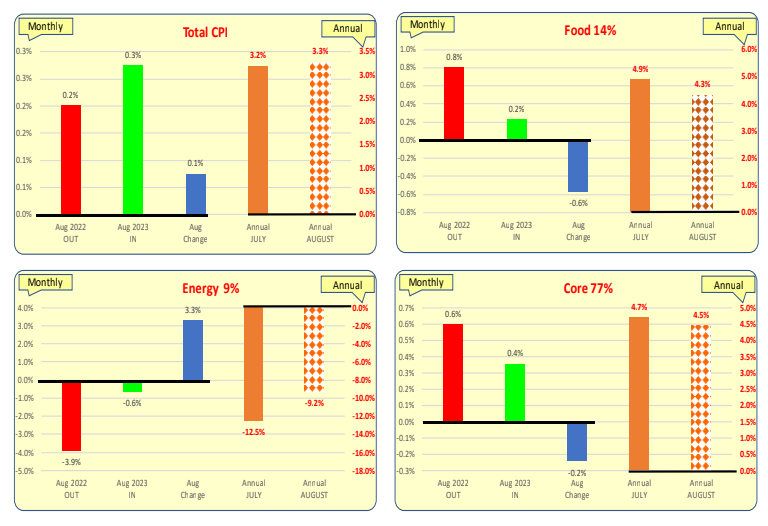
Total CPI: The annual CPI is a rolling aggregate of 12 monthly data points. Visualize it as a sequence of 12 dominoes – as a new one enters, the oldest one topples off. For instance, the next in line after Aug 2022’s 0.2% is Aug 2023’s, estimated at 0.3%, which will replace the oldest point.
The Total CPI is set to rise until August 2023, with the older blue bar (Aug 2022’s 0.2%) giving way to a new estimated blue bar of 0.3%. This shift will elevate the annual CPI from 3.2% to 3.3%.
Energy and Food: When considering energy, it’s important to acknowledge the immense scale. The blue bar representing Aug 2022 is a negative value, and it will soon be removed from the calculation. Consequently, the rolling 12-month total is set to rise on September 13, leading to an increase in the annual CPI.
In terms of food, a significant decrease is anticipated as the substantial increase from Aug 2022 phases out.
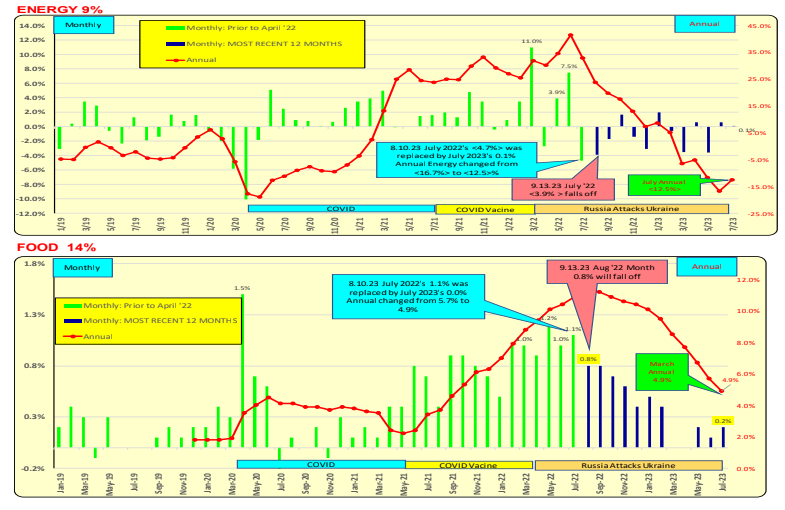
Gas Prices: are an international factor that affects everyone. Following Putin’s invasion of Ukraine on 2.24.22, gas prices surged by 19% in a single month, specifically March 2022. However, the 17% spike observed in June 2022 ceased to impact the data as of July 12, 2023. The momentum of improvement in the total CPI, driven by energy price declines, has moderated.

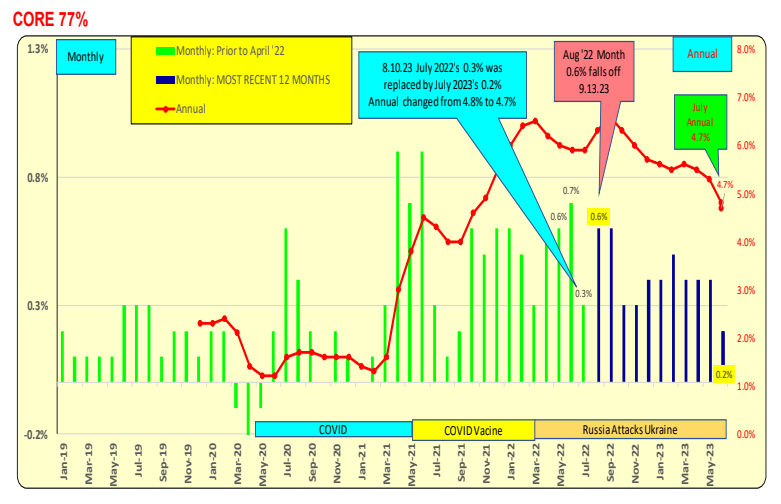
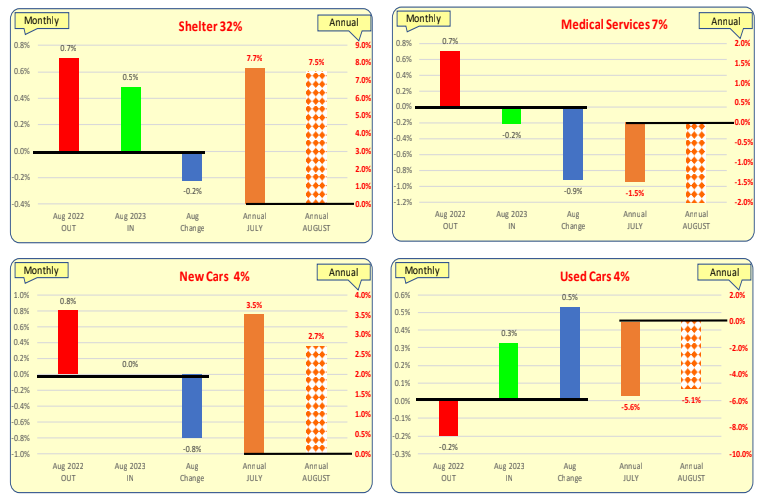
Core CPI: Core CPI constitutes 77% of the overall CPI. Within this category, shelter stands as the largest component, accounting for 32% of all consumer expenditures. The Core CPI is expected to show improvement in the August 2023 data, which will be released on 9.13.23, indicating progress over the next two months.
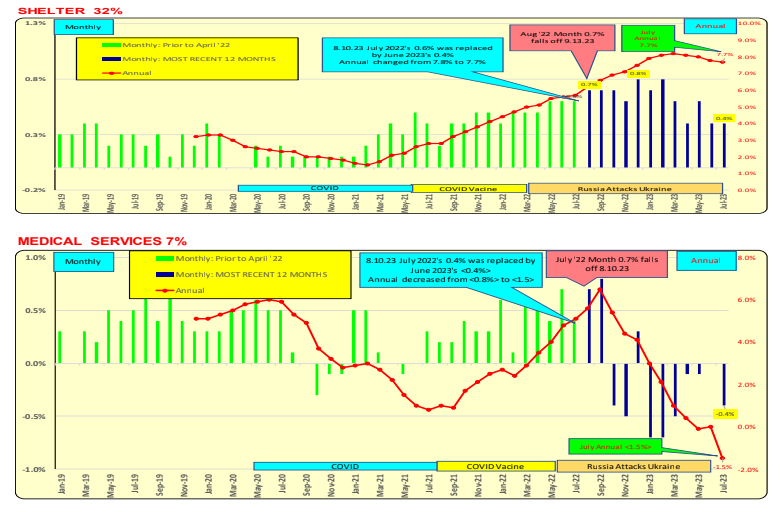
Shelter and Medical: The trend for Shelter is expected to shift downwards as repriced lease data becomes accessible. While changes in this component will lag behind the CPI improvement, they will contribute to moderating the CPI in the latter months of 2023 and into early 2024. Meanwhile, Medical services are anticipated to continue decreasing over the next two months.
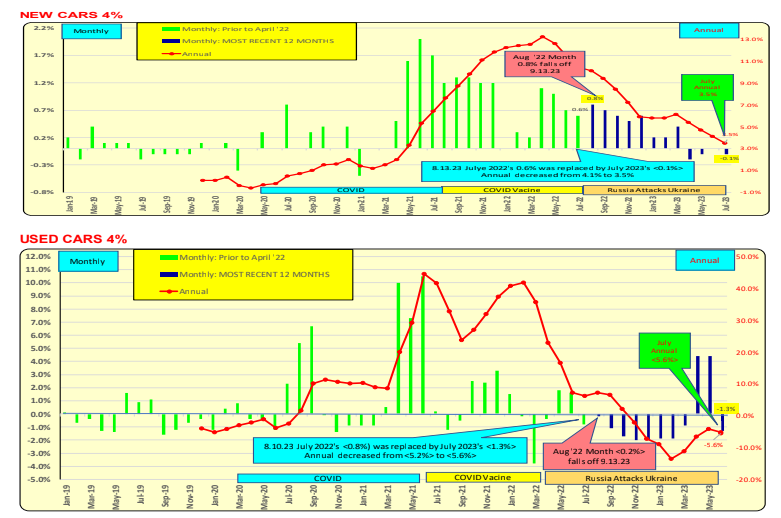
New Vehicles and Used Vehicles: New car inflation will continue to decrease when Aug 2022 data rolls
off, this will have a material CPI improvement. Used car price decreases stopped while new car production and inventory replenishment continues..
Inflation Projection: The report for August 2023 is scheduled for release on 9.13.23. The Total CPI is expected to rise from 3.2% to 3.3% as the Aug 2022 figure of 0.2% is no longer considered. Energy prices are anticipated to increase, driven by both recent rises and the removal of the negative value from August 2022.
Inflation Projection: In August, the majority of categories are expected to improve, with shelter showing marginal enhancement. The red bars represent August 2022 and will be removed by 8.13.23. The green bars indicate the new data for August 2023, while the blue lines indicate changes within the month—when the blue number is negative, it signifies an improvement in inflation.
The Federal Reserve employs the PCE Index as a benchmark and target for inflation. When comparing CPI to PCE, it’s crucial to consider that CPI is consistently higher than PCE. Currently, the difference is 50bp.
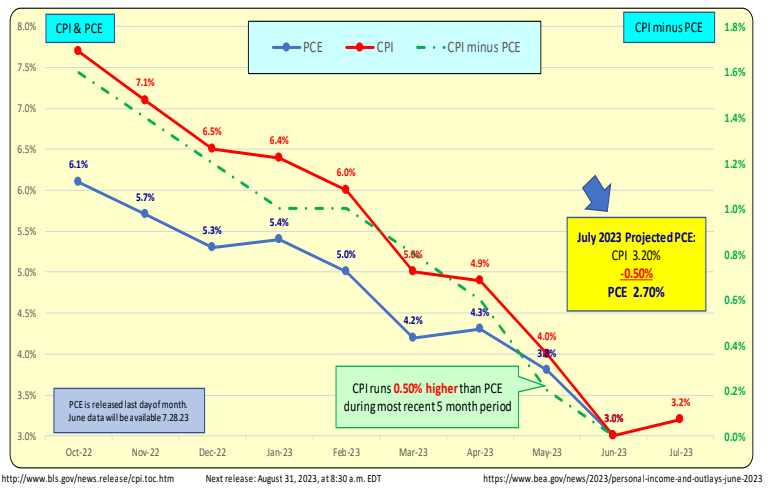
The Federal Reserve employs the PCE Index as a benchmark and target for inflation. When comparing CPI to PCE, it’s crucial to consider that CPI is consistently higher than PCE. Currently, the difference is 50bp.
Bill Knudson, Research Analyst LANDCO ARESC