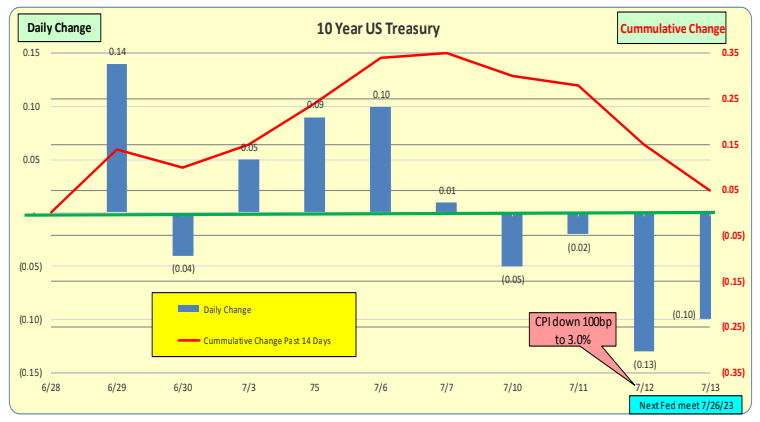
For the past 2 weeks, 10-Year Treasury rates were up 5bp. In the past week, they were down 29bp. On May 3rd, 2023, the Fed made an announcement that broadly hinted that future rate increases would be in a “wait and see” mode. CPI is down from 4.9% to 4.0% on 6.13.23, and on 6.14.23, for the first time in 15 months, the Fed did not increase rates. On 7.12.23, CPI is down 100bp to 3.0%. The next Fed meeting is on 7.26.23.
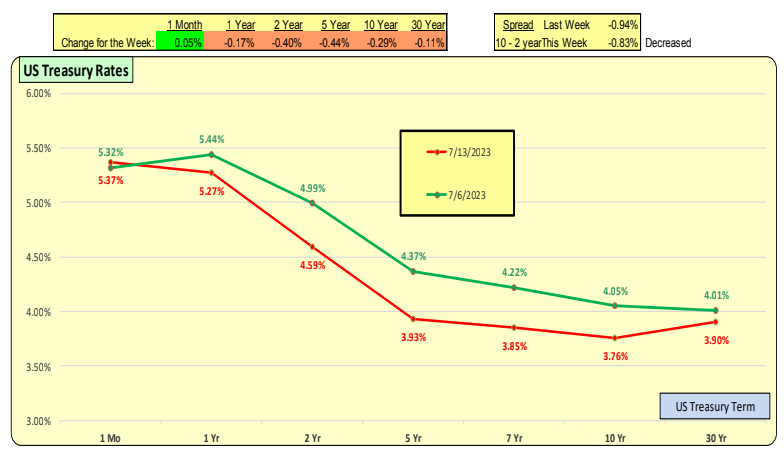
The red line represents the current rates, while the green line represents rates from one week ago. The entire yield curve for the 2-year term decreased by 40bp, and the 10-year decreased by 29bp. This made the inverted yield curve steeper. The one-month rates were up 5bp.
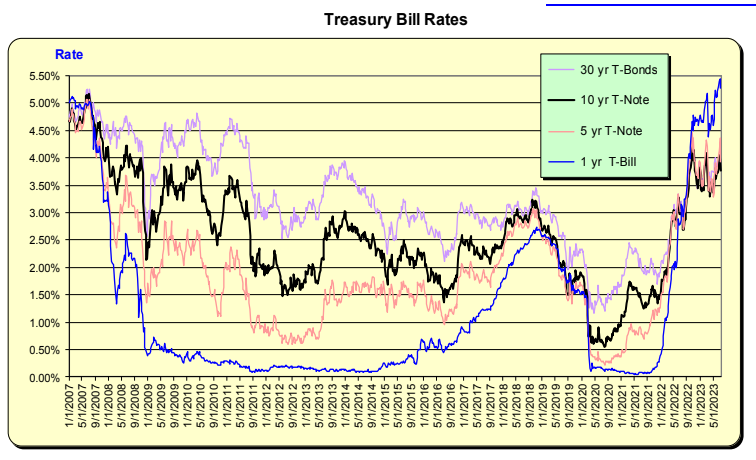
Over the past 16 years, the yield curve has not been inverted anywhere close to where it is now. The blue line represents 1-year T-bill rates, and the black line represents the 10-year rates. The blue line should be below the black line, indicating a positively sloped yield curve. We are nowhere close to this currently. To return to a positively sloped yield curve, either short-term rates need to decline or long-term rates need to increase. 1-year rates now exceed those in 2007.