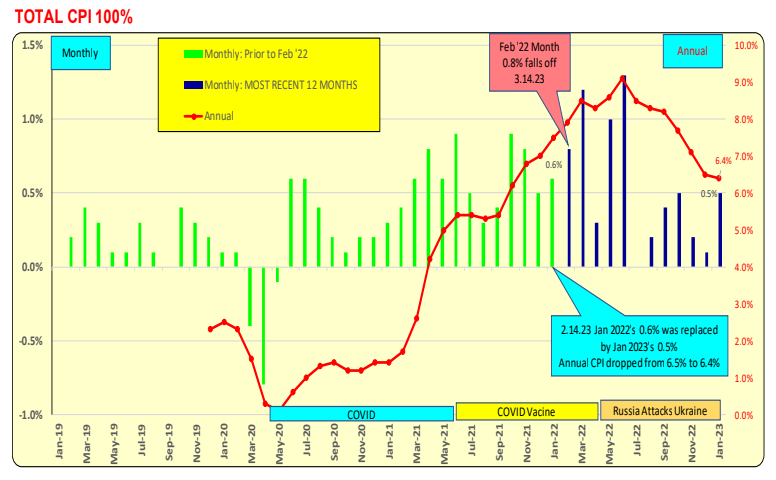
Inflation forecast: The annual CPI total reported each month is a combined string of 12 months of data. Think of it as a set of 12 dominoes, where a new one comes on and the oldest one drops off. These are the two dominoes to look at to see if the CPI has improved or worsened. For instance, if the monthly rate for February 2023 is 0.3%, it will replace the February 2022 data point of 0.8% on March 14, 2023, and the annual CPI will decrease from 6.4% to 6.1%.
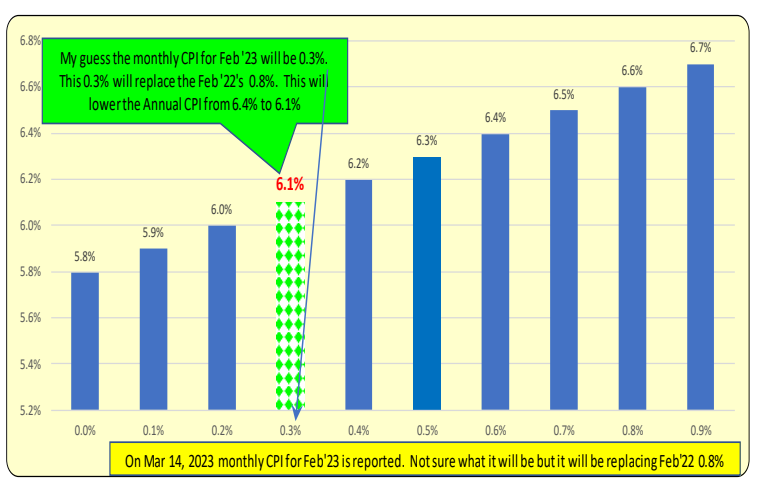
It is estimated that the monthly rate for February will be 0.3% when it is announced on 3.14.23, but it could be higher or lower. Therefore, the annual CPI for February will change accordingly. Below is a range of potential February monthly rates, from 0.0% to 0.9%. The resulting annual CPI will range from 5.8% to 6.7%.
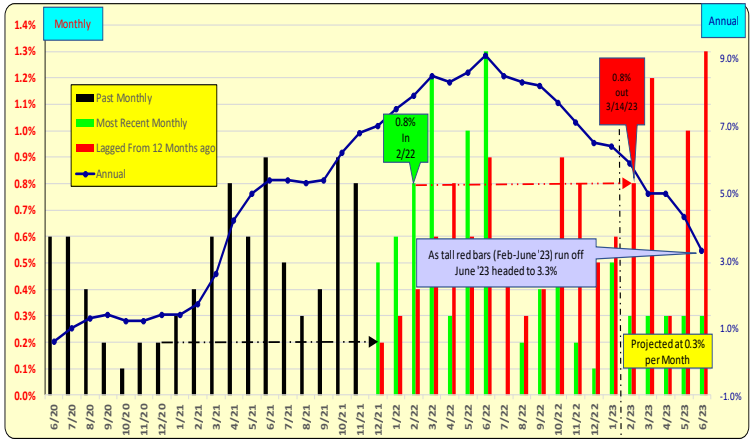
Where is the CPI headed?
If the monthly CPI comes in at 0.3% between February ’23 and June ’23, we could potentially have an annual CPI of 3.3% by July 12, 2023, when the June ’23 CPI data is reported. How would this happen? The large monthly rates in March, May, and June of 2022 will be replaced by new monthly 2023 data for those months, assuming the replacement monthly rate is also 0.3%.
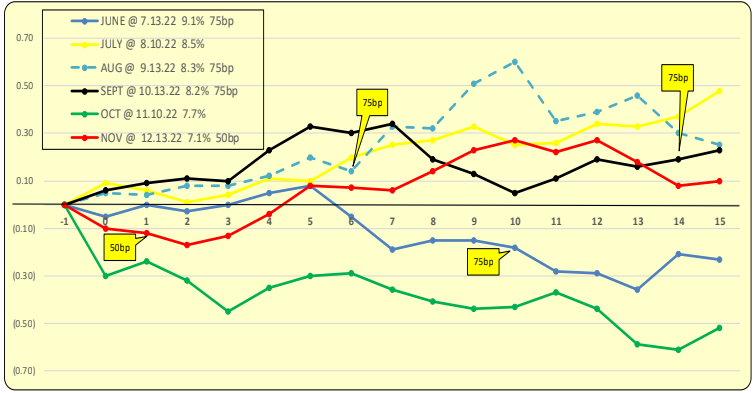
Will CPI improvement cause 10-year US Treasury rates to decline? The answer is sometimes.
On November 10, 2022, the October ’22 annual CPI declined from 8.2% to 7.7%. The cumulative decrease in 10-year rates almost reached 50bp three days later (see green line). Note the 30bp drop from the day before (day 0). On December 13, 2022, the November ’22 annual CPI declined by a larger amount, from 7.7% to 7.1%, but after five days, 10-year rates were 10bp higher and continued to rise thereafter (see red line).
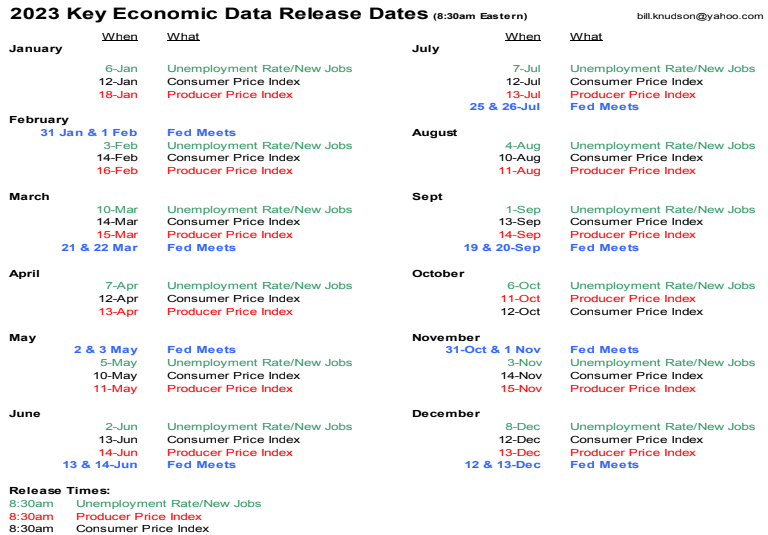
2023 Economic Data Release Calendar: CPI, Employment, and Fed Meetings.
Bill Knudson, Research Analyst LANDCO ARESC