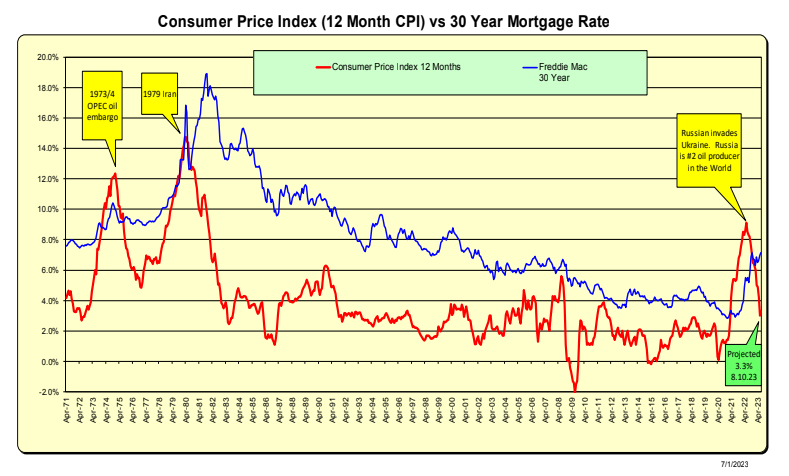
Inflation History: Over the past 50 years, the US has had three inflationary time periods, all related to oil/gas prices. Note as fast as inflation spiked, it fell off just as dramatically.
Additionally, It is worth noting that mortgage rates do follow the CPI lead, but there is a lag time involved. Rates tend to skyrocket and then gradually decrease. No one wants to be the first to lower rates in case the market experiences a decrease in stall.
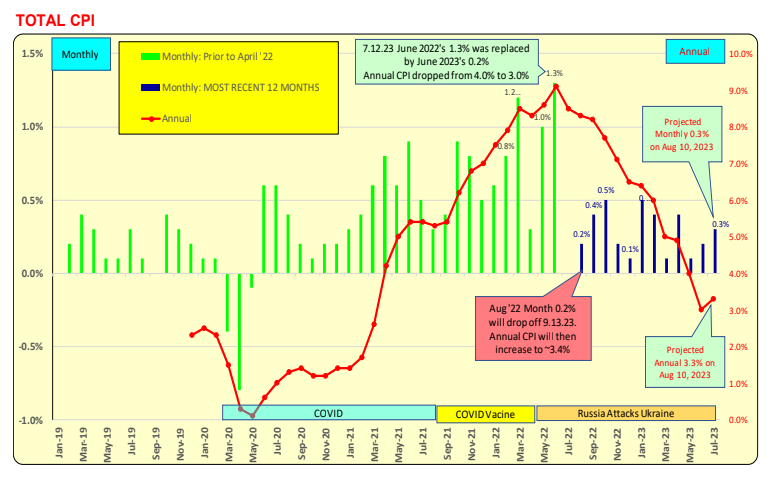
Inflation Forecast: The annual CPI total reported each month is a combined string of 12 months of data, similar to a row of dominos. As a new month’s date is added, the oldest one drops off. The two most recent data points are crucial in determining if the CPI will change. For instance, if the monthly rate for July ’23 is 0.3% it will replace the June ‘22 data point of 0.0% on August 10, 2023, causing the annual CPI to increase from 3.0% to ~3.3%.
Predicted July’s monthly CPI to be released 8/10/2023
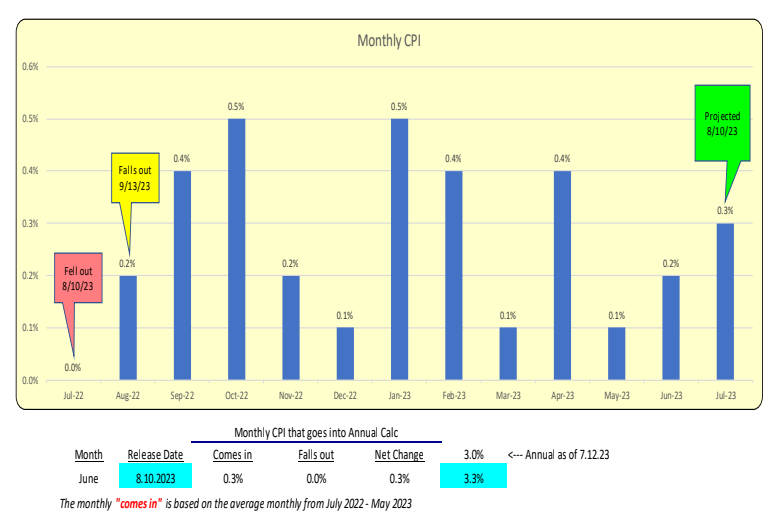
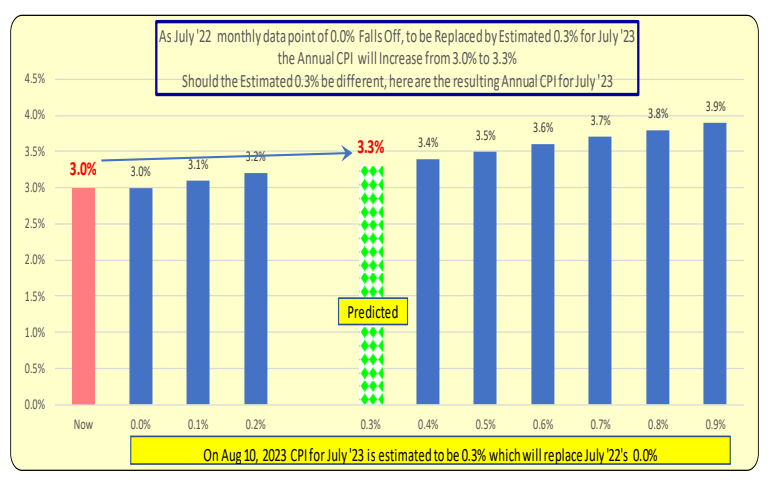
It is a guesstimate that the monthly rate for July will be 0.3% when the actual data is announced on August 10, 2023. However, it is important to note that the actual rate could be higher or lower. Consequently, the annual CPI for July will change accordingly. The projected range for July’s monthly rate is from 0.0% to 0.9%. Therefore, the resulting annual CPI will range from 3.0% to 3.9%.
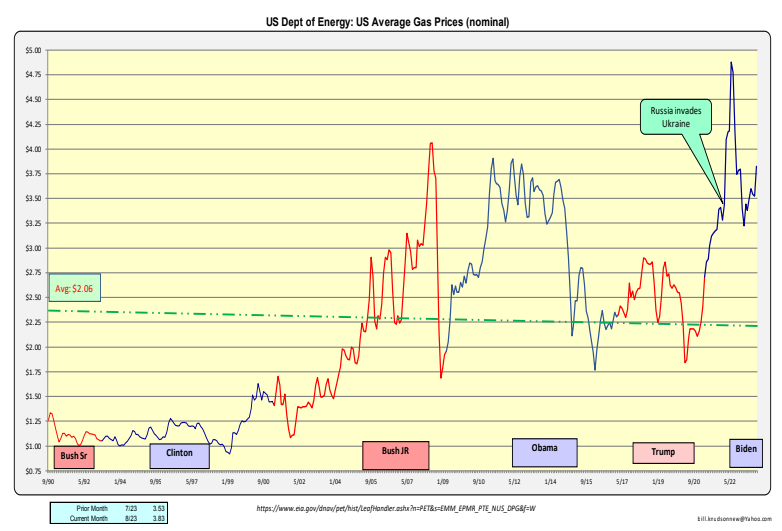
If there is any single item in the CPI that can have a swift and significant impact on its value, it is energy. Although energy prices have been increasing since the beginning of the year, material changes have not occurred. They were up 10% from July 1 to August 1.
Bill Knudson, Research Analyst LANDCO ARESC