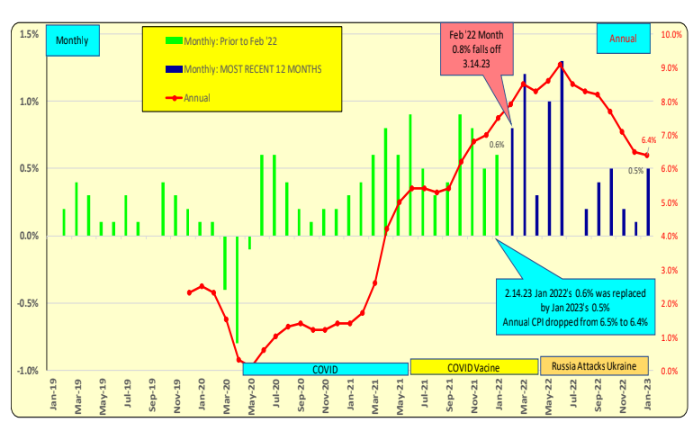
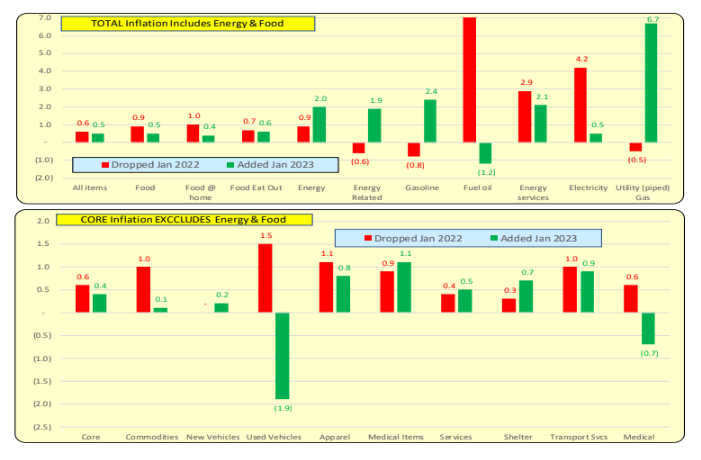
INFLATION: The annual number reported each month is a combined string of 12 months of data, think of it as being 12 dominoes, a new one comes on, the oldest one drops off. THESE are the 2 dominoes to look to see if things got better or worse (blue bars). In Jan ‘23 the month came in at <0.5%> and it replaced the Jan ‘22 0.6% on 2.14.23. These bars were about equal, hence 12 month change was minor 6.5% to 6.4%.
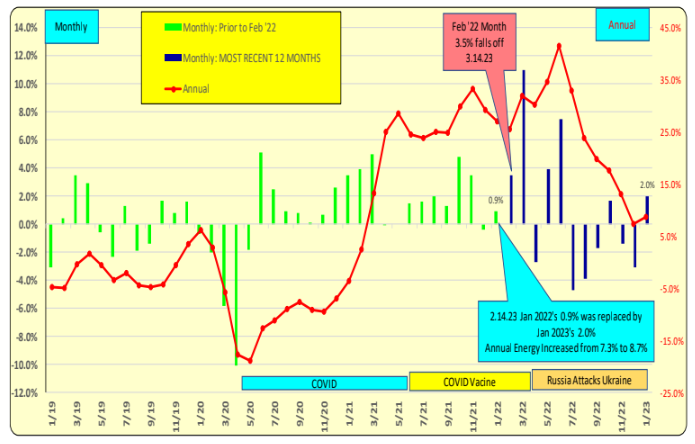
INFLATION: Energy prices have been THE major driver of inflation in 2022. Jan ’22’s 0.9% dropped off on 2.14.23 and was replaced by 2.0% for Jan ’23. Note that the March ’22 spike will fall off on 4.12.23. This WILL cause a material decrease to the CPI.
INFLATION: the 12 month CPI decreased from 6.5% to 6.4% for January 2023 as reported on 2.14.23. Energy prices increased in January and for the year are up 9% and that is world wide Exclude energy, food and Used Cars and inflation was 5.0%. The Federal Reserve sets interest rates based on the PCE which is 4.3%.
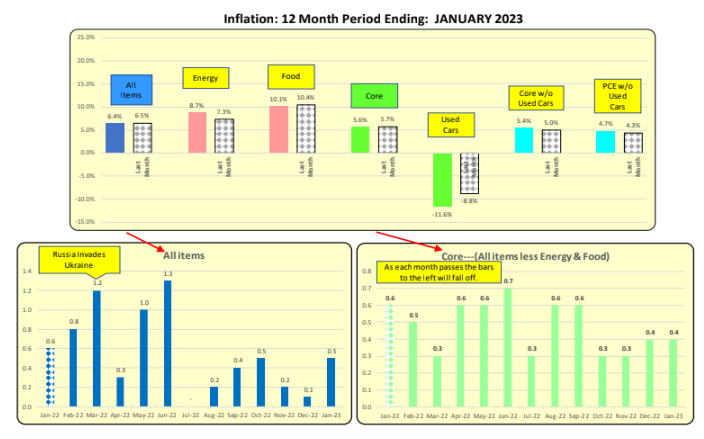
INFLATION’s major causes are: higher Energy and to a lesser extent Food. As a bar gets closer to the LEFT, it will fall off as new monthly data becomes available. The black hatched bar is the month that has recently fallen off and has been replaced by the most recent month’s data, that being Dec 2022. Higher interest rates will NOT solve these isolated sources of inflation.
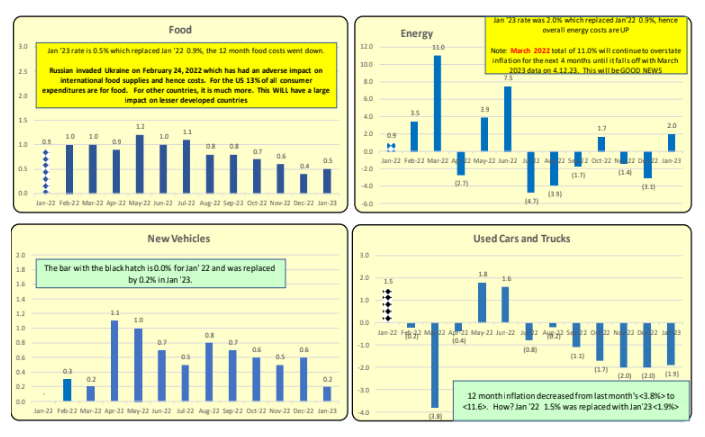
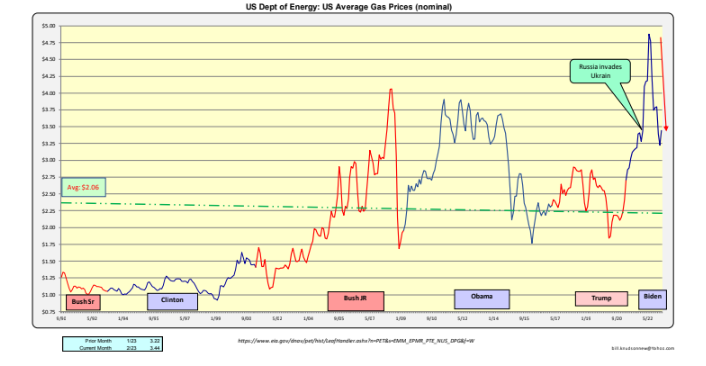
GAS PRICES are an international item that effects all. Putin invades Ukraine 2.24.22 Gas prices were up 19% for the ONE month alone: March 2022 The March 2022 spike will continue to be included in the annual CPI calculation for the next 2 months and will drop off on 4.12, 23 The 17% June gas prices surge will fall off 7.12.23
Jan 2022 data (red) was replaced by Jan 2023 (green). When red is larger than green, then inflation for that item will improve. When green is larger, then inflation is WORSE.
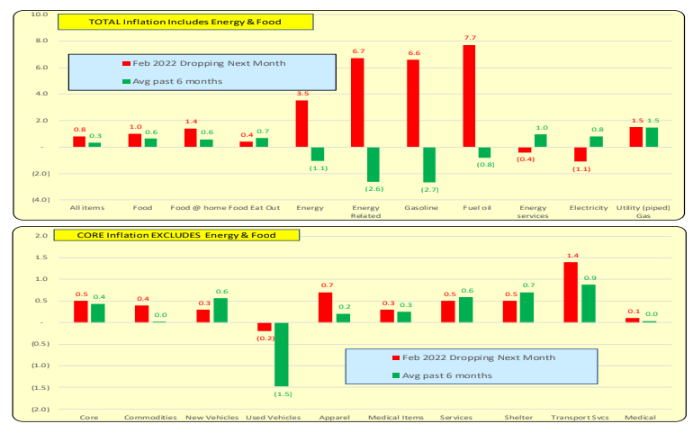
NEXT month will have new data for Feb 2023, therefore Feb 2022 data will drop off ON 3.14.23. Feb 2022 is the RED bars. The green bar is the average of the prior 6 months (Aug ‘22-Jan‘23). When green is larger, then inflation is worse. For the Core component note NEW & USED Cars will drop off.
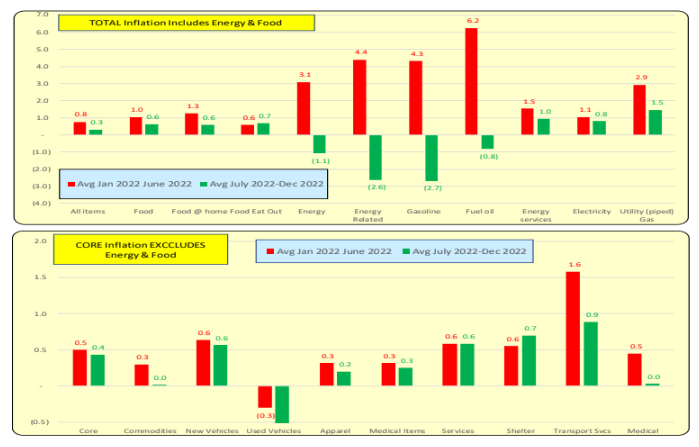
The red bars are the MONTHLY average of Feb ‘22-July ‘22 while the green bars are the average of Aug ‘22-Jan ‘23. When green is larger, then inflation is worse. A monthly 0.4% is about a 5.0% annual rate.
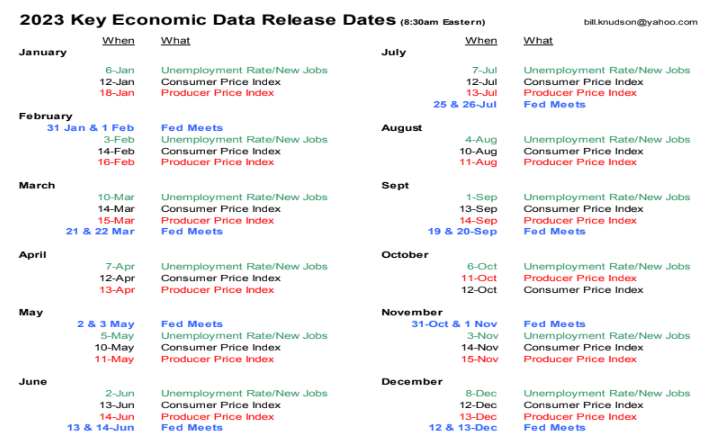
Below are the publication dates of the CPI, PPI and Net New Jobs—data pertains to prior month of economic activity. There items will be key factors during the Federal Reserve’s meetings which are also listed below.
Bill Knudson, Research Analyst LANDCO ARESC