The Consumer Price Index (CPI) for June 2022 data was released today and the year-over-year increase went from 8.6% to 9.1%.
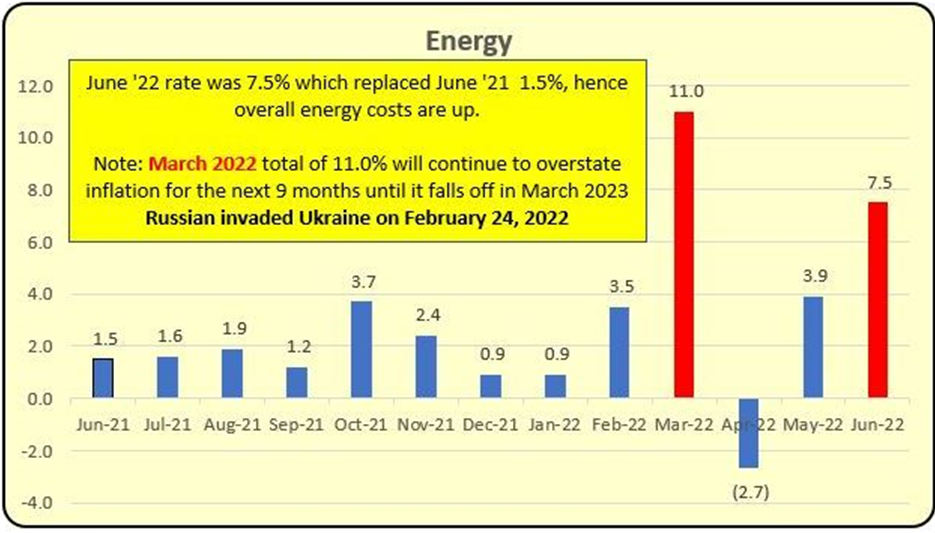
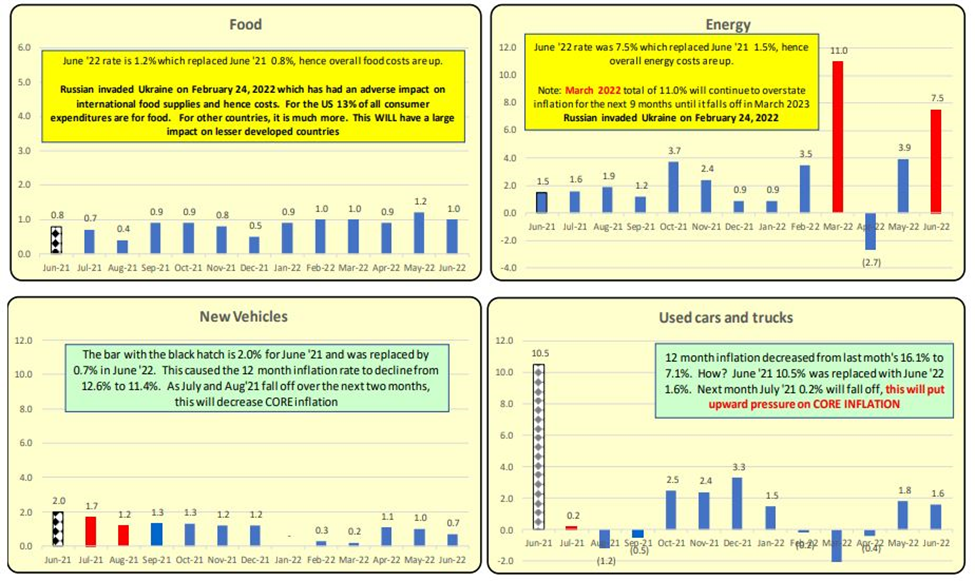
The main driver of the increase in March was due to soaring energy costs due to Russia’s invasion of Ukraine which began on Feb 24, 2022. The one-month increase was 11% while the annual rate is 35%. June’s run-up in energy prices is attributed to summer seasonal demand factors.
Remember last month’s CPI e-mail? “Gas prices were up 19% in March. For June they are up 17%. This impact will be included in the next CPI update which will include June data and is due out July 13—this WILL cause the overall CPI to rise again–maybe exceed 9.0%?”
Overall Energy Costs Up
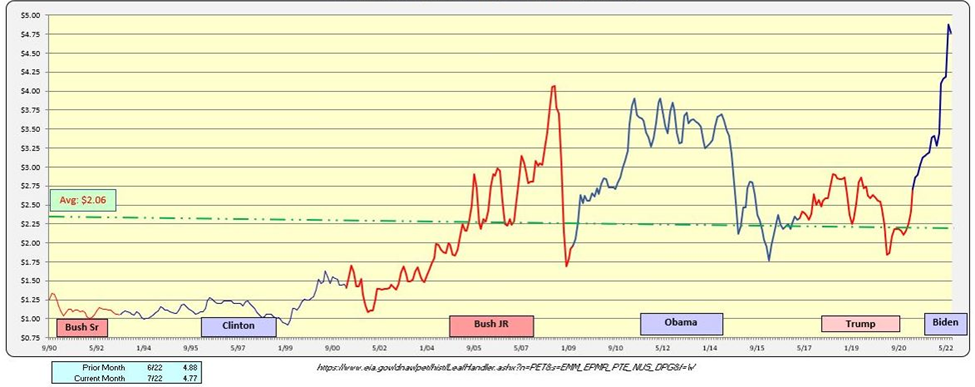
Below the graph shows gas prices which have declined slightly in July and that should be of small help in July’s CPI total due out on August 10.
Gas Prices Down Slightly
The energy price bumps of 11% in March 2022 and 7.5% in June 2022 will remain in the CPI calculation for the next 12 months and won’t drop off until April 2023 and July 2023. It will give a continuing appearance that we have a high annual inflation rate due to these two single months’ spikes. Given how job growth is robust and inflation is up, the Federal Reserve will likely continue with its announced future rate increases into the foreseeable future.
Core inflation (less Energy and Food) annual core decreased from 6.0% to 5.9% primarily due to Used Car Price spikes in 2021 dropping off. There are no further decreases by Used Cars to help Core in the coming future months. In fact, the upcoming 3 months to be dropped off for July thru Sept 2021 Core averaged 0.3 and will likely be replaced by somewhat higher levels ~0.5.
Inflation: 12-Month Period Ending: JUNE 2022
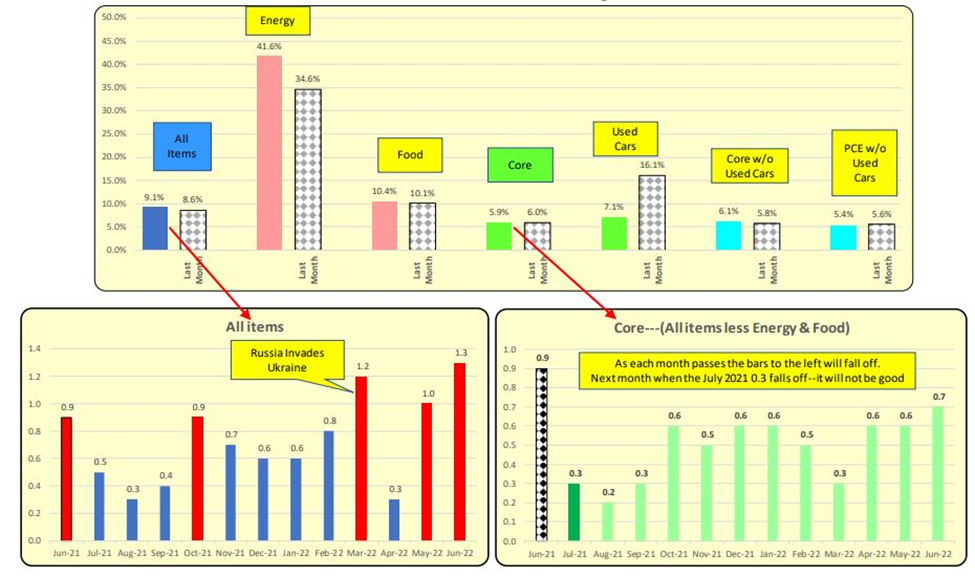
Energy prices were up 42% which is being seen worldwide. If we exclude energy, food, and Used Cars and inflation was at 6.1%. The Federal Reserve sets interest rates based on Personal Consumption Expenditures (PCE) which is 5.4%.
Inflation’s Major Causes – Energy and Food
INFLATION’s major causes are higher Energy and to a lesser extent Food. As a bar gets closer to the LEFT, it will fall off as new monthly data becomes available. The black hatched bar is the month that has recently fallen off and has been replaced by the most recent month’s data, that being June 2022. Higher interest rates will NOT solve these isolated sources of inflation.
US Dept. of Energy: US Average Gas Prices (nominal)
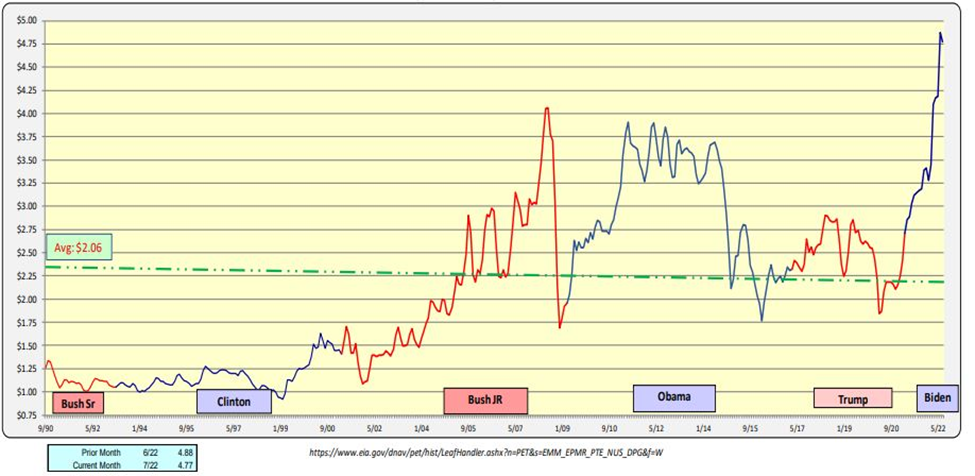
GAS PRICES are an international item that affects all. As stated earlier, gas prices were up 19% in one month alone, due to the invasion of Ukraine. The March 2022 spike will continue to be included in the annual CPI calculation for the next 10 months. For June gas prices are up 17% over May. This increase will show up in June’s CPI to be reported on July 13. This was UGLY. Gas prices for July are down slightly from June.
Inflation – June 2021 V.S June 2022
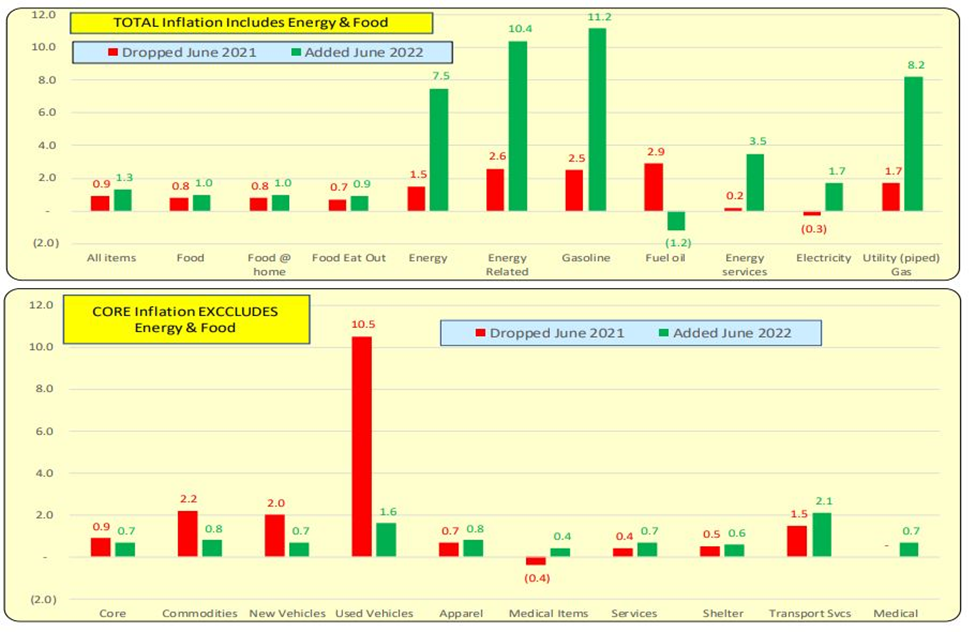
June 2021 data (red bar) was replaced by June 2022 (green bar). When the red bar is larger than the green bar, then inflation for that item in May 2021 will be RED. When green is larger, then inflation is WORSE.
Core Inflation Excluding Energy and Food
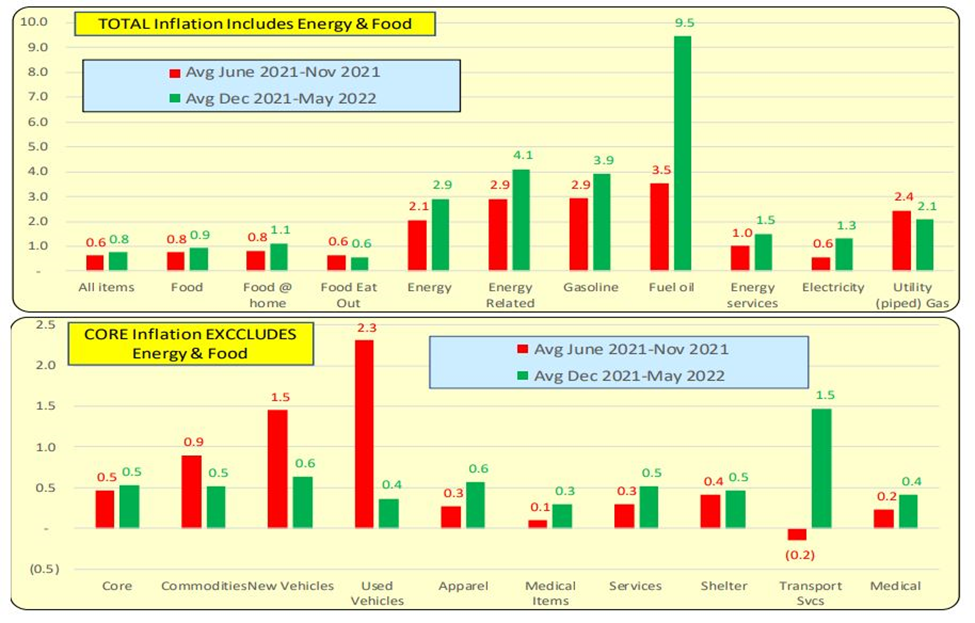
The red bars are the average of July 21-Dec ‘21 while the green bars are the average of Jan ‘22-June ‘22. When green is larger, then inflation is worse. Note Core inflation the negative impacts of the tall red bars indicates lowered inflationary pressures on Core components.
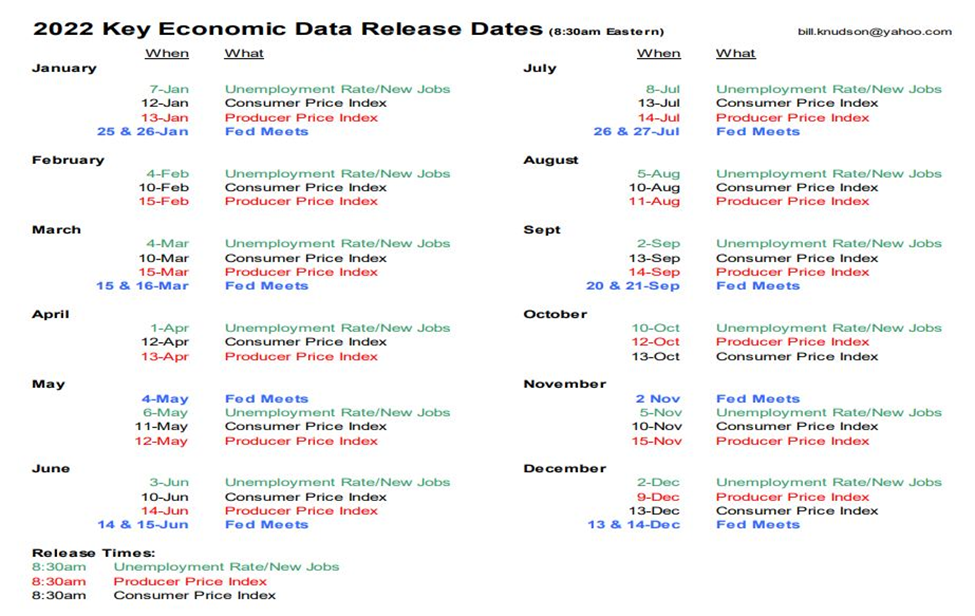
2022 Key Economic Data Release Dates
Bill Knudson – Research Analyst for Landco ARESC