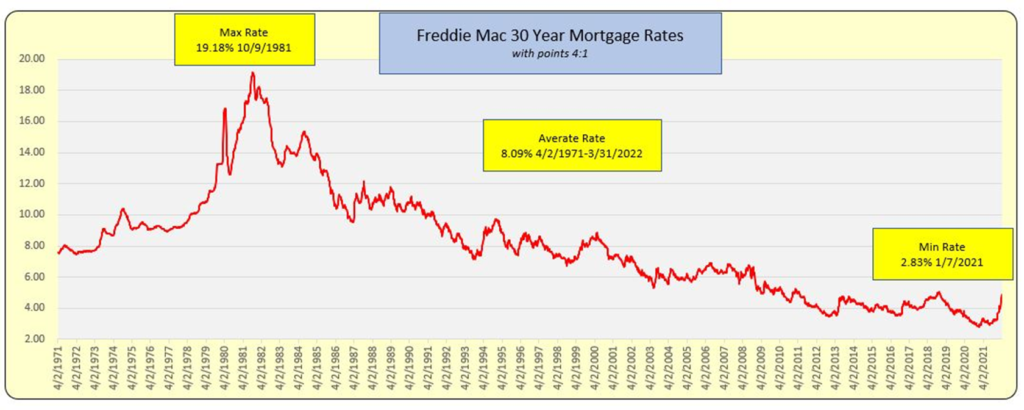
Freddie Mac has weekly 30 Year mortgage rates going back to 1971. The highest rate was 19.18% and it occurred on October 9,1981 while the lowest rate of 2.83% occurred on January 7, 2021. The average for this 51 year time span is 8.09%. Freddie Mac includes both rates and points. Dividing points by 4 and adding it to the stated rate provides a zero points, mortgage rate. Mortgage rates over the past 3 weeks have increased 82bp. By reviewing Freddie Mac rates over the past 51 years places the 82 bps increase in the top 1% of ALL changes.
Freddie Mac – 30 Year Rate Chart

The following images show the one week, two week and three week change and resulting standard deviations in the Freddie Mac 30 year rates. Indeed, the past 3 are a very, very rare event. It should also be noted that the 82 bps increase occurred when rates were 4.05%. In 1981 similar large increases occurred but rates were ~17.75%
Rate Changes in (ONE WEEK)

The 51 year time span has 2,660 weeks. Calculating the ONE week rate change provides a distribution curve seen below. Nearly 50% of the weeks had changes between -10 bps and +10 bps. For EACH of the 3 weeks ending leading up to 3.31.22 resulted in increases of 31, 26 and 25. 3 Standard Deviations of weekly changes is 33. Each of the weeks were in the 2% chance of any ONE week occurring, let alone 3 consecutive weeks.
Rate Changes in (TWO WEEKS)

Two-week change in rates, 60% are between -10 and +10. The two week change ending 3.31.22 was 51 bps. 3 Standard Deviations of two week changes is 53 bps which means the 3.31.22 two week change is nearly a 1% change event over the past 51 years.
Rate Changes in (THREE WEEKS)

For the three week change in rates, 50% are between -10 and +10. The three week change ending 3.31.22 was 82 bps. 3 Standard Deviations of three week changes is 71 bps which means for the 3.31.22 three week change it was a 1% chance of this event occurring over the past 51 years.
Bill Knudson, Research Analyst Landco ARESC
