Total 4 quarter return for March 31st, 2022 attained a RECORD HIGH of 21.9% but look out for rising 10 Year US Treasury Rates.
NCREIF Total Property Returns
The main driver was industrial property returns of 52%. YES, 52% That is NOT a typo!
In NCREIF’s ~47-year history, this is the highest return for ANY PROPERTY TYPE. Apartments were next with 24% followed by Office and Retail with 7%.
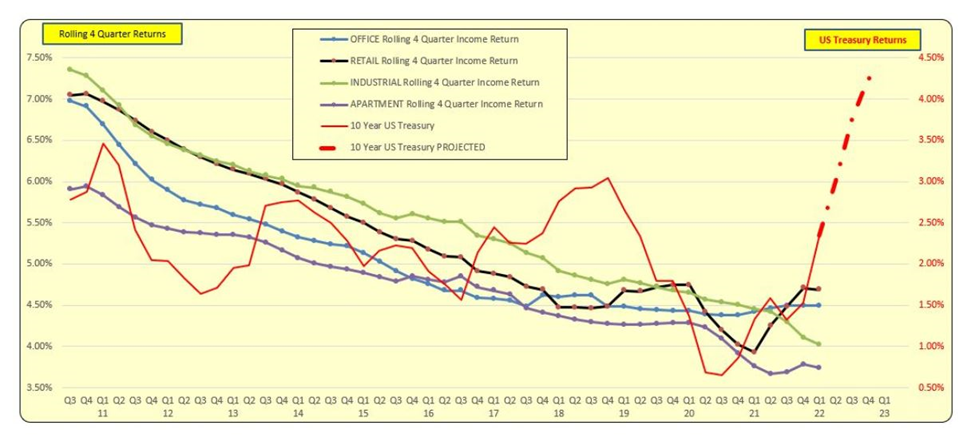
It was noted that BOTH NCRIEF INCOME Returns, and the US 10 Year Treasury rates were at or near RECORD LOWS in 2021. It was also noted that the 10 Year Treasury rate had decreased during most of 2011-2021.
On March 16th, 2022 the Federal Reserve clearly stated that interest rates would be increasing. The red dashed line is the projected 10 Year Treasury rate through the end of 2022 (shown in the graph below).
While there may not be a direct cause and effect relationship between the 10 Year Treasury and NCREIF Income and hence Appreciation returns, there is a correlation. This correlation is material over longer time periods and will likely have an adverse impact on future property valuations and returns.
Total Annual Return
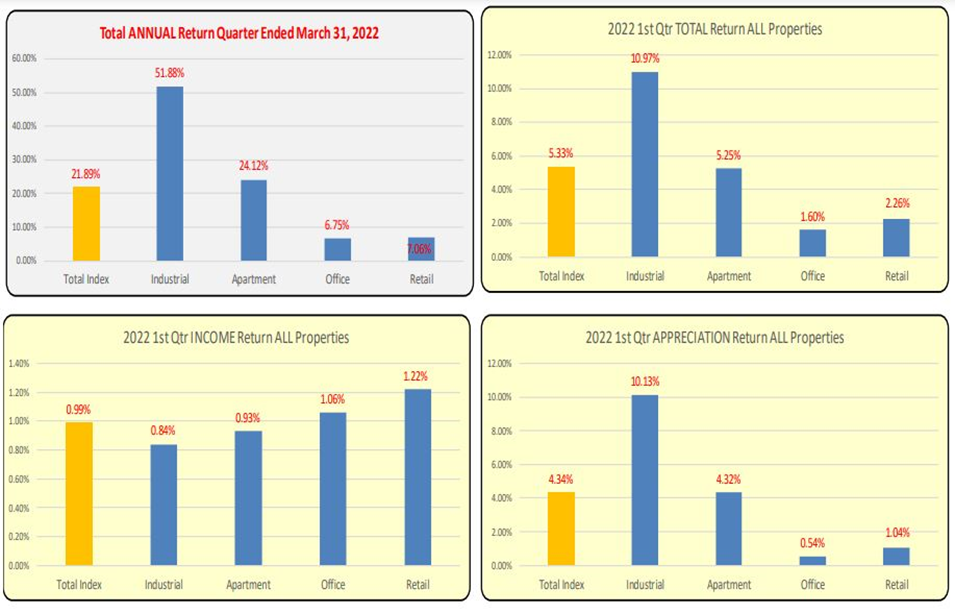
Industrial properties had the lowest Income Return but had the highest appreciation return AGAIN that is near RECORD levels. Industrial income return is at it’s LOWEST LEVEL EVER.
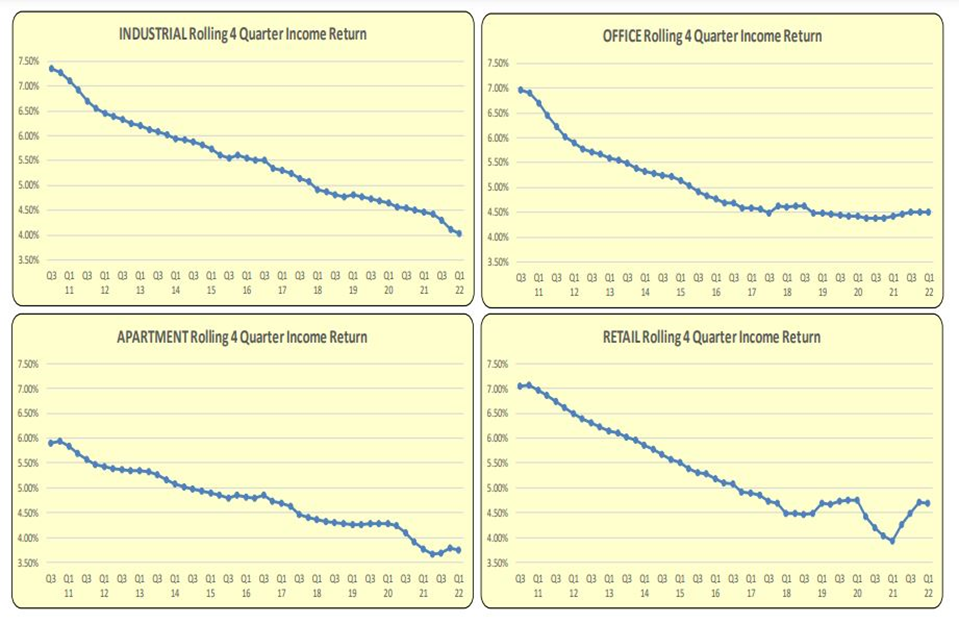
Rolling 4 Quarter Income Returns for all 4 property types are near record lows. This implies cap rates are also near record lows.
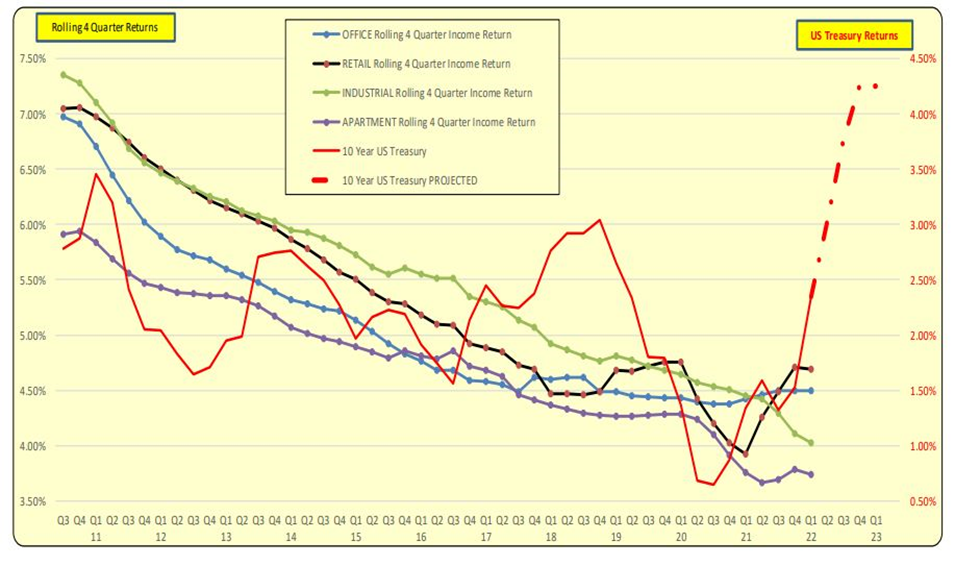
US 10 Year Treasury Rate and Rolling 4 Quarter Income Returns have a high correlation. Property returns in essence are risk based relative to the US Treasury 10 year rates—which dramatically increased in Q1. Dashed red line is projected rates thru yearend based on Fed’s 3.16.22 “dot plot” of anticipated rate increases thru 2022. This would have a material impact on both income and appreciation returns going forward.
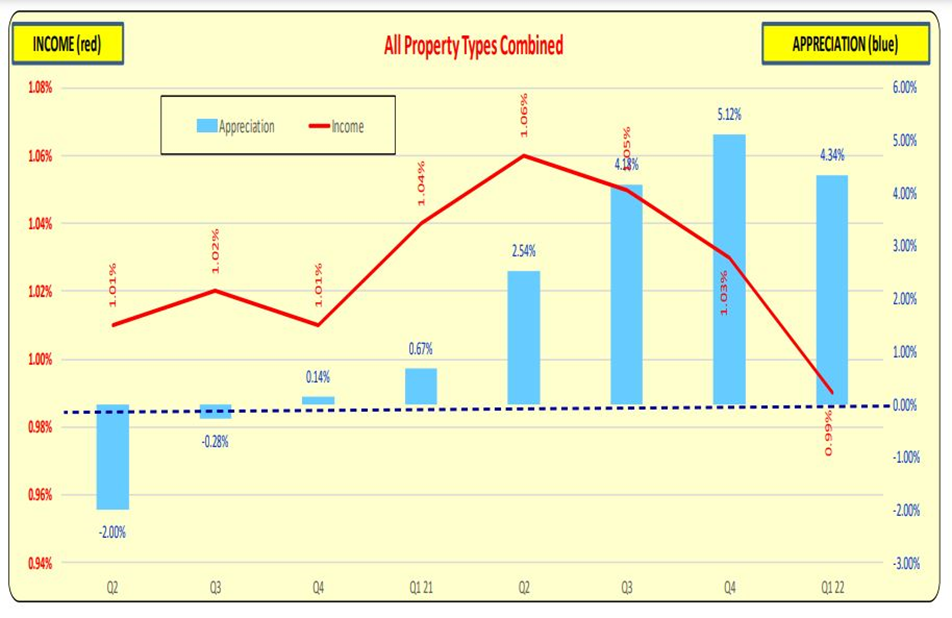
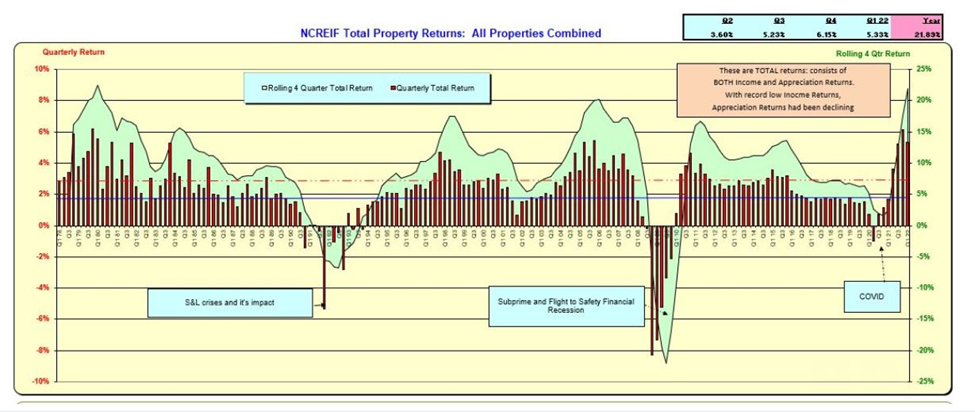
ALL PROPERTY TYPES COMBINED: Income returns are tapering off as appreciation increases are recorded. The appreciation returns spikes continue to be driven by record increases in industrial properties.
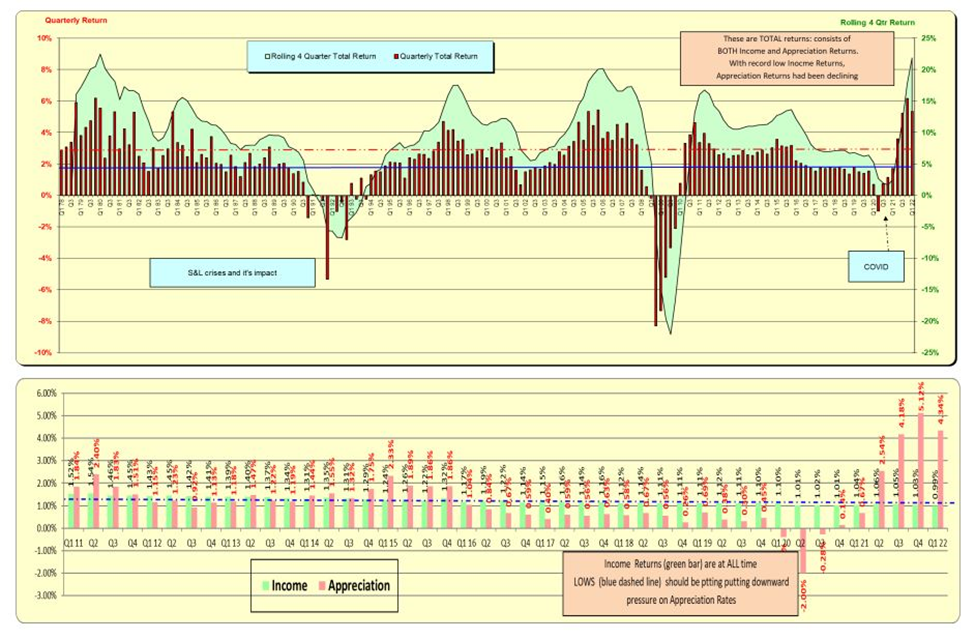
ALL PROPERTIES COMBINED: Annual return for Q4 came in at a near-record rate of 21.89% driven primarily by Industrial properties. Note in the lower graphic that quarterly income returns are DECLINING.
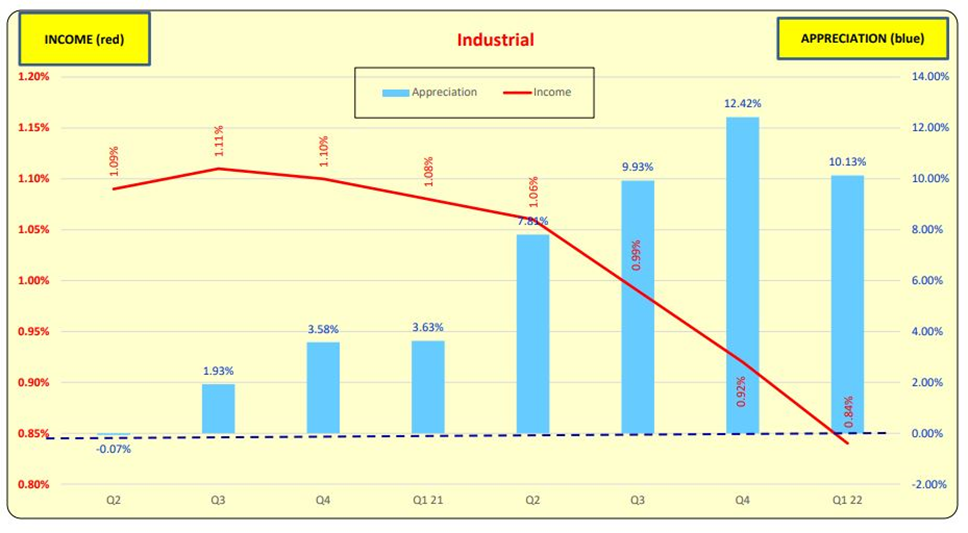
Industrial
Total returns are being driven by record-shattering Appreciation returns. Income returns have been decreasing indicating that FUTURE income increases are anticipated or CAP RATES are decreasing. With rising 10 Year Treasury rates, whether the lower cap rates can be maintained is subject to debate. It is true that demand for Industrial property increased during the 2020-2022 COVID out break as people stayed home and did more online shopping. With COVID becoming less of a public policy issue, it remains to be seen if the online shopping trend will remain at high levels..
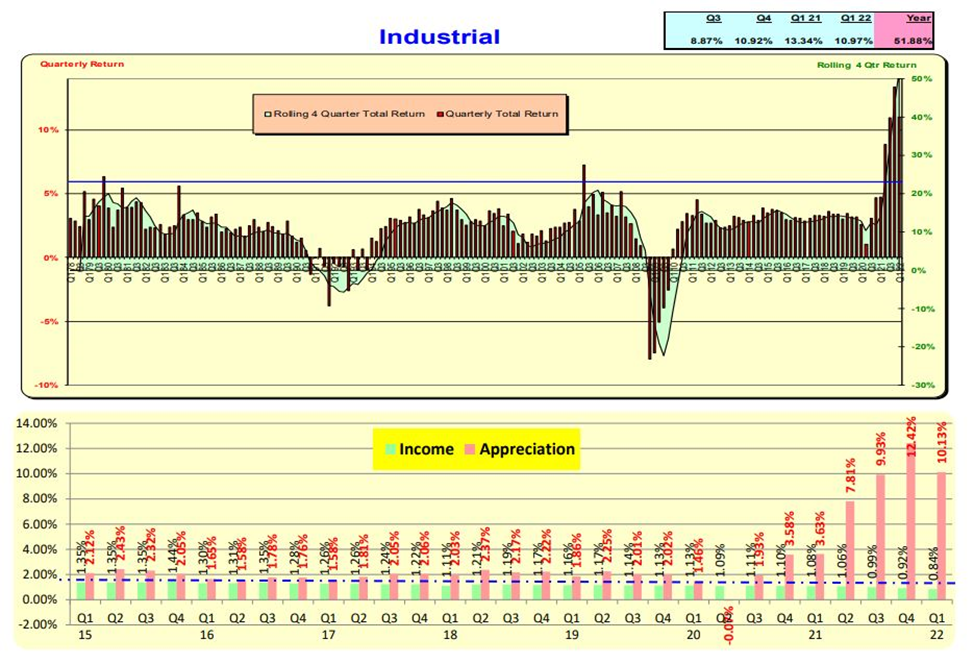
INDUSTRIAL: Returns are THE LARGEST APPRECIATION EVER—since ~1976 NCREIF Index creation.

INDUSTRIAL PROPERTIES as a % of NCREIF: NCREIF’s composition by property type gradually changes over time. Below are the changes from the 10-year period from Q4 2011 to Q2 2021. There has been a material increase in industrial Properties. Because of this composition change, the Total NCREIF return is higher due to record-shattering returns posted by industrial properties.
Office: Income and Appreciation
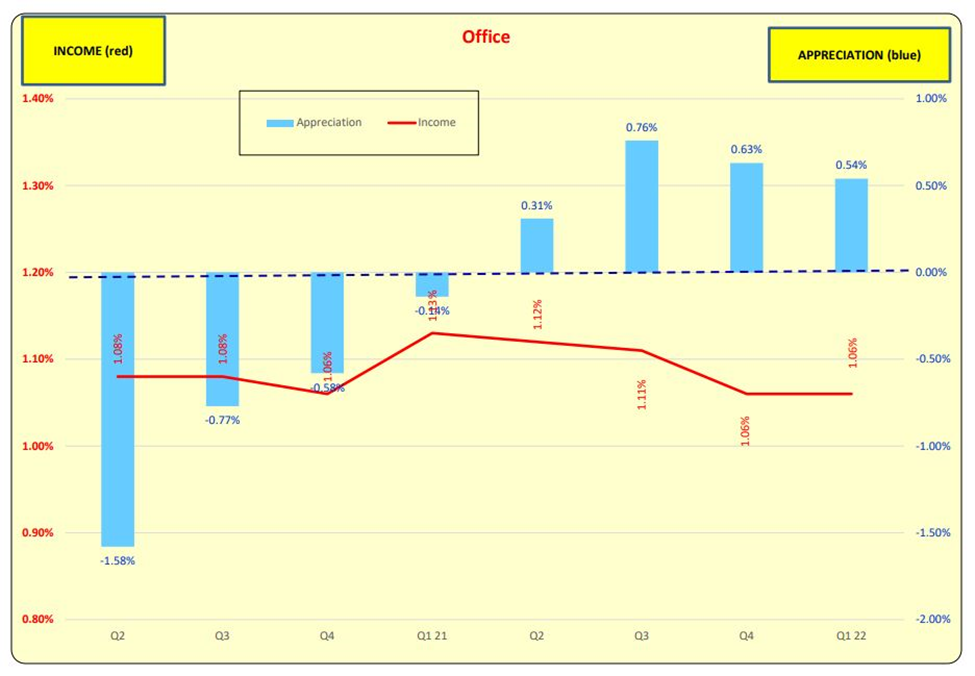
OFFICE: Income returns have tapered off as appreciation returns increased.
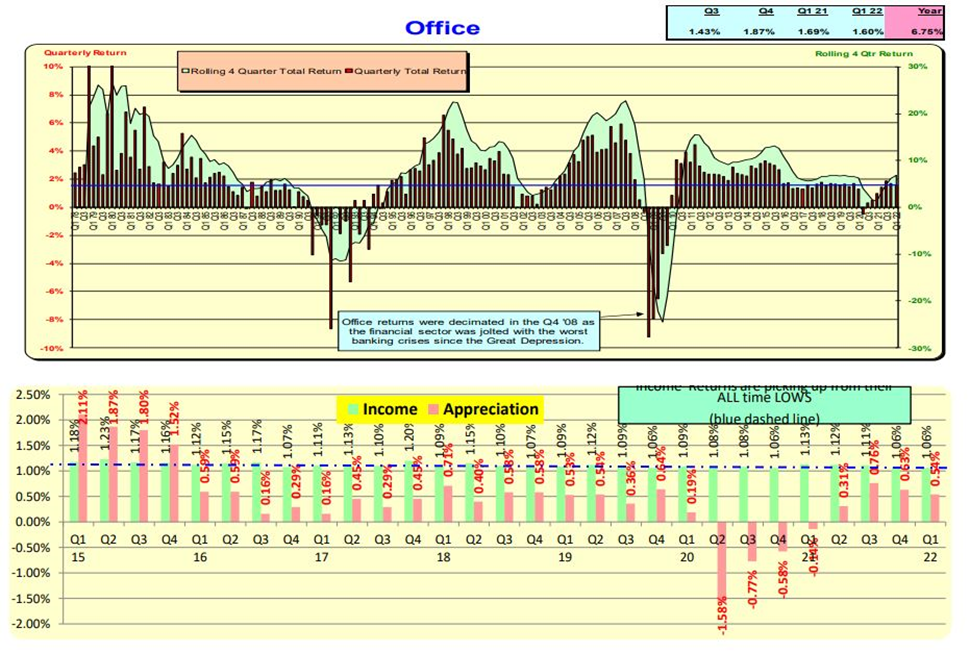
OFFICE: Income returns have been relatively flat. Appreciation plummeted in Q2 2020 COVID but have improved since then.

Apartment Income Return
Income returns bottom out in Q4 2020 when record-low mortgage occurred and have risen since. Appreciation returns have followed a similar pattern.

APARTMENT: INCOME returns increased driving APPRECIATION RETURNS to record high’s.
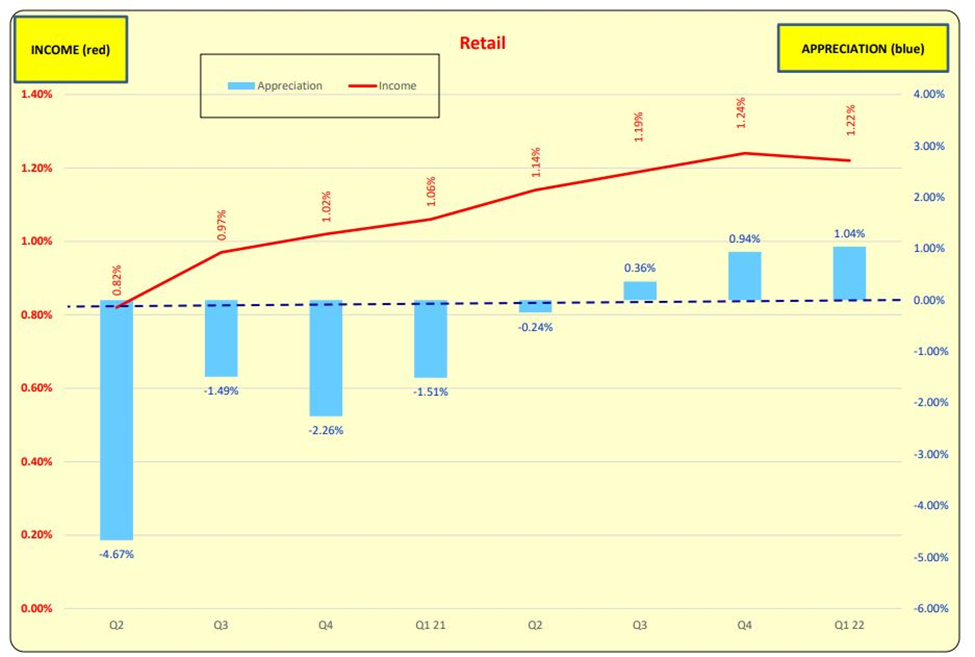
Retail Return
Income return have been slowly increasing as property appreciation has modestly increased.
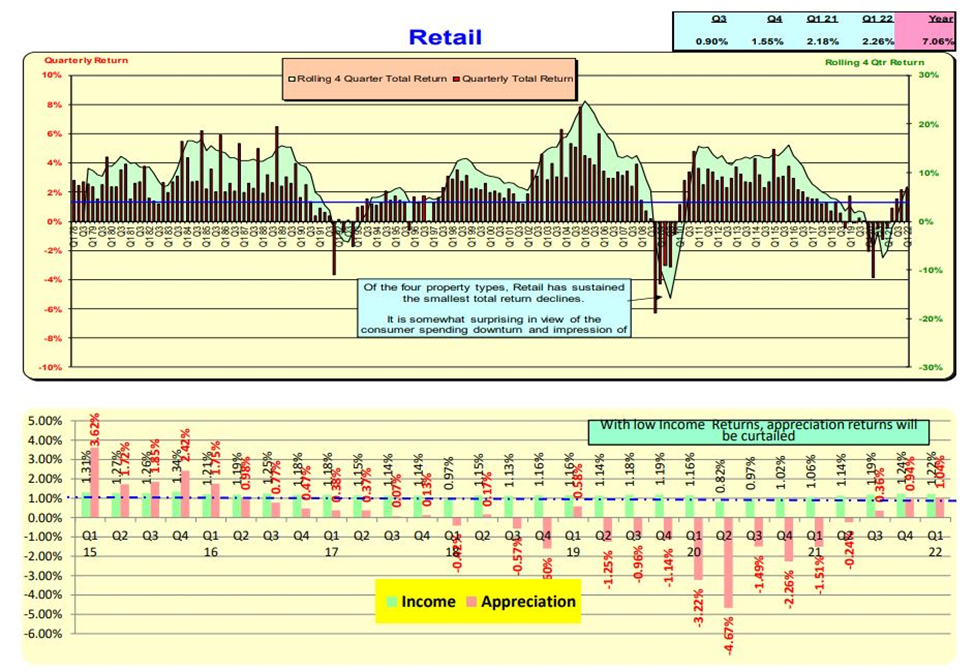
RETAIL: As INCOME returns have slowly increased, appreciation returns have also increased.
Bill Knudson, Research Analyst Landco ARESC