For the past 2 weeks, 10-Year Treasury rates were down 19bp. Past week: down 1bp.
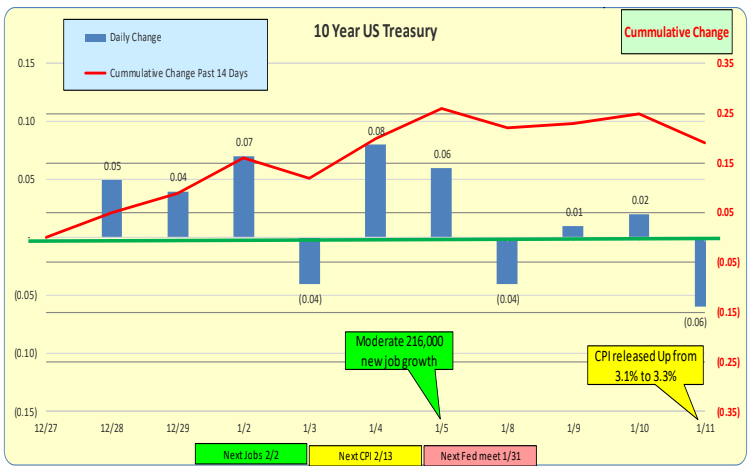
Red line represents the most current rates, while the green line represents rates from one week ago.
Longer-term rates decreased relative to shorter-term rates; as a result, the inverted yield curve is less steep. For terms of 5+ years, the Yield Curve is positive. One-month rates were down 1bp.

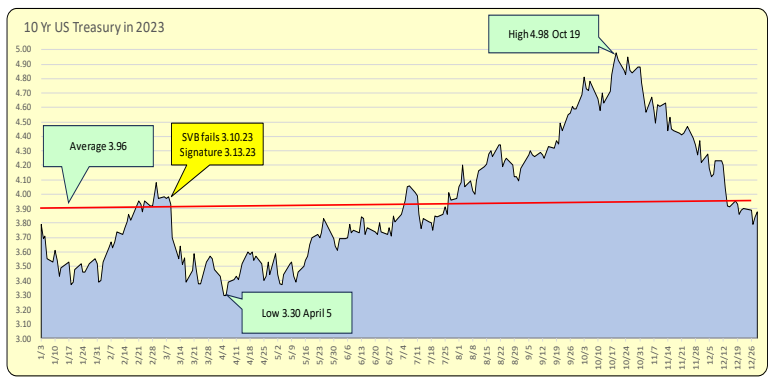
The 10-Year US Treasury rate is a vital metric to keep track of. It is used as a benchmark spread for home mortgage rate setting and is also employed in Commercial Real Estate valuation determination. Below are the daily rates in 2023. It starts the year at 3.79% and reaches its low of 3.30% on April 5, then rockets up to 4.98% on Oct 19, and finally plummets to 3.88% on Dec 31. That is a 22% drop from the high to the year-end. This is significant. Any firm holding this instrument benefited from higher values, as well as Commercial Real Estate (CRE). The beginning and year-end values are about equal, and both are close to the year’s average of 3.96%. 2023 was a wild ride in rates and, hence, values.
Daily changes are shown below. It is noted that there were more rate decreases of <15bp> than there were rate increases of 15bp. Surprisingly, larger daily decreases occurred than increases of similar magnitudes.
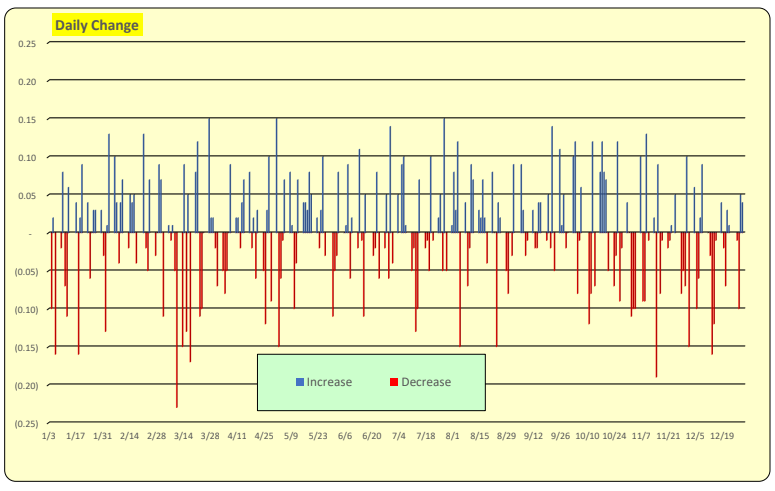
95% of the daily changes were in the blue bars, both increases and decreases. This is 2 standard deviations.
The key take away is when a 15bp change occurs, it is a 2 sigma event (i.e. very unusual) based on 2023 rates.

Bill Knudson, Research Analyst LANDCO ARESC