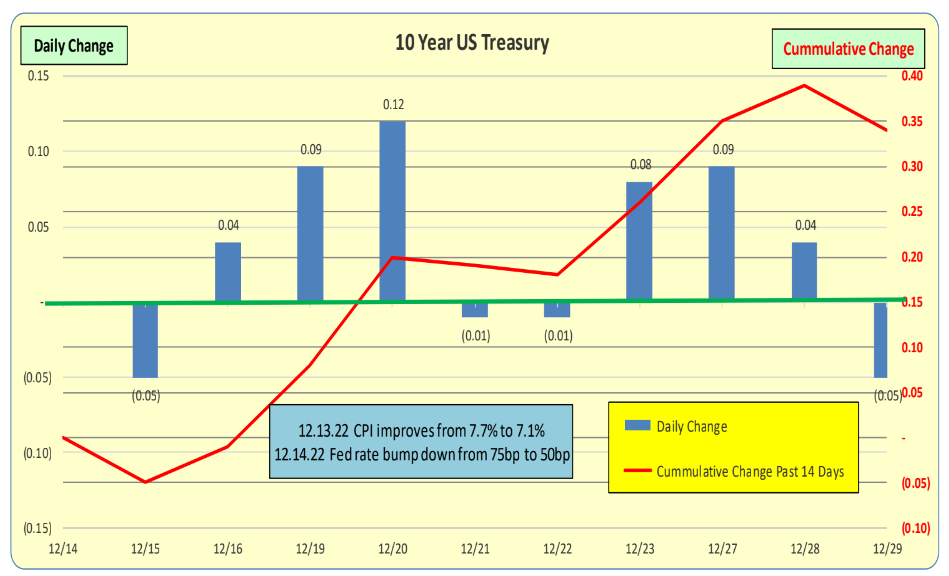
Daily changes in the US 10 Year Treasury rates are the blue bars while the red line is the 14 day cumulative change in rates: <1bp> cumulative DECREASE. For the blue bars it is unusual to have changes of greater than 0.10 in a single day and 0.20 is VERY unusual. 30bp is beyond rare.
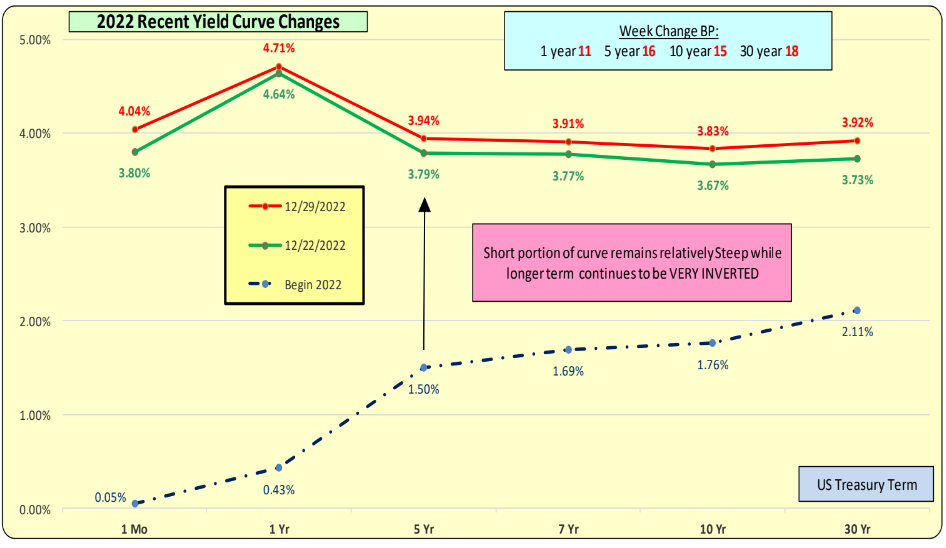
Red line is most current rates while green line is one week ago.
Longer term rates were up significantly for the week. Yield curve decreased but continues to be inverted.
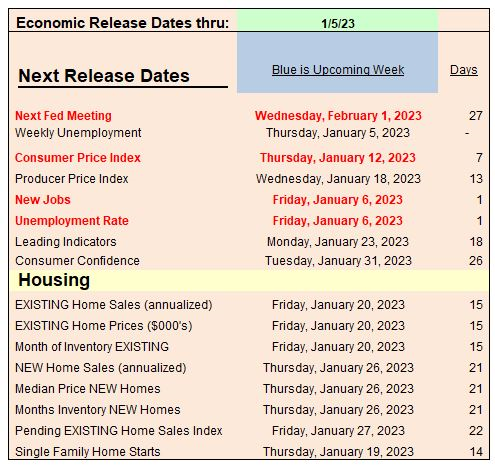
Key Econ Items in the up coming week that will impact Treasury and Mortgage Rates are high lighted in BLUE.