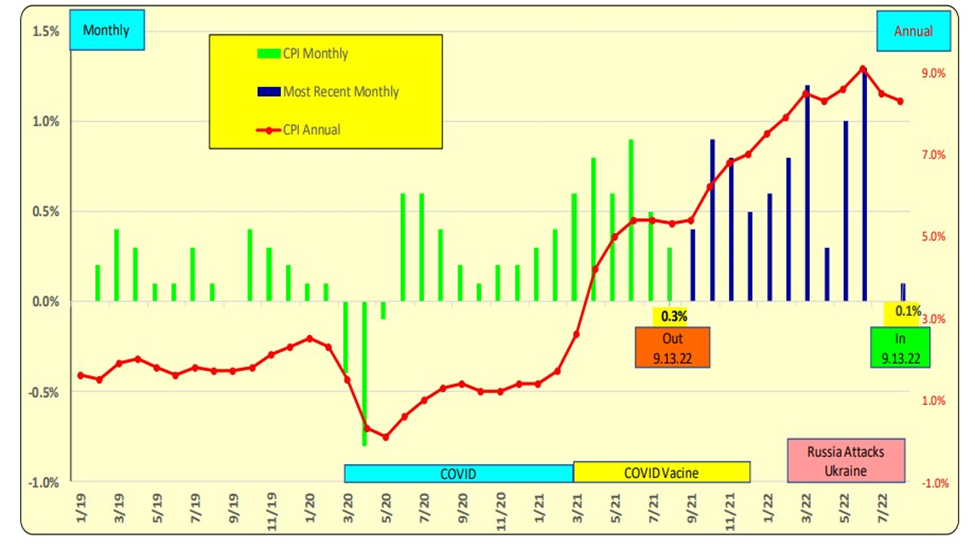
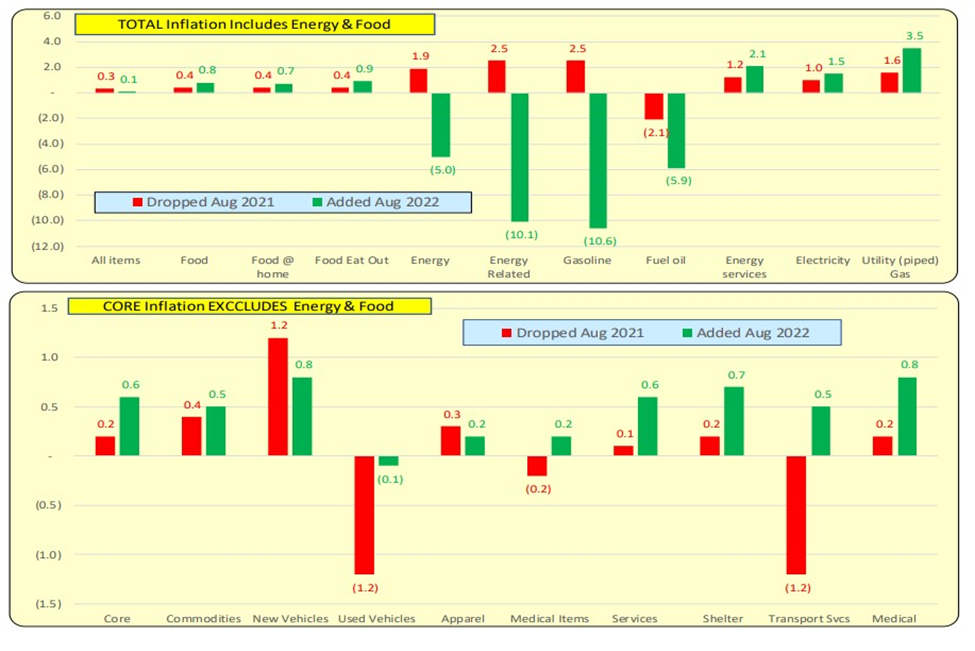
INFLATION: The annual number reported each month is a combined string of 12 months of data, think of it as being 12 dominoes, a new one comes on, and the oldest one drops off. THESE are the 2 dominoes to look at to see if things got better or worse. In August of 2022, the month came in at 0.1% and it replaced August of 2021 which was also low at 0.3%. One low number replaced another low number, and as such not much change occurred. We won’t get the benefit of a high monthly number dropping off until Nov 10 when October 2021’s large number drops off. The midterm election is on Nov 8th.
INFLATION: the 12-month CPI decreased from 8.5% to 8.3% for July 2022. Energy prices decreased in August but for the year are up 23% and that is worldwide Exclude energy, food, and Used Cars and inflation was 6.3%. The Federal Reserve sets interest rates based on the PCE which is 5.6%.
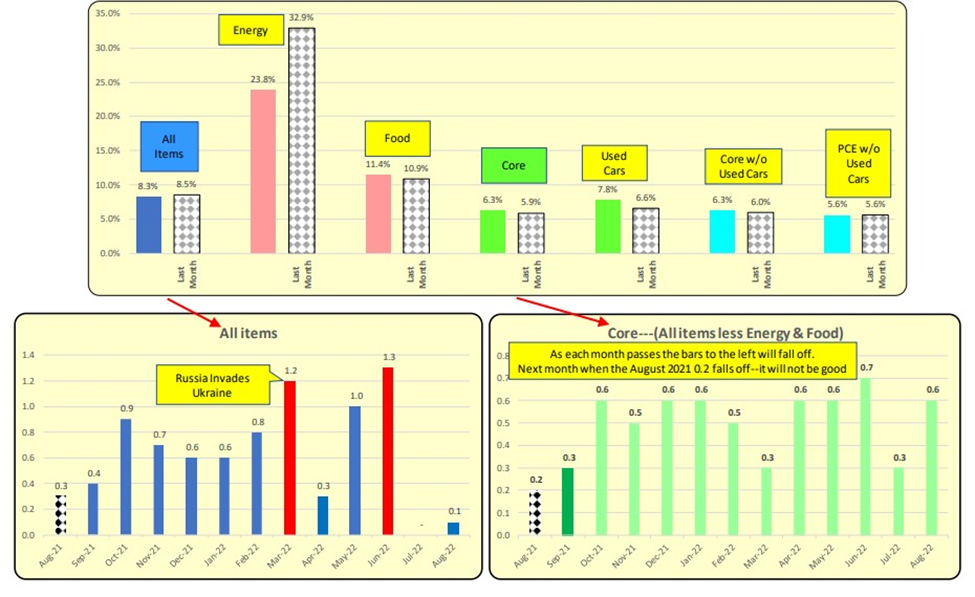
INFLATION’s major causes are higher Energy and to a lesser extent Food. As a bar gets closer to the LEFT, it will fall off as new monthly data becomes available. The black hatched bar is the month that has recently fallen off and has been replaced by the most recent month’s data, that being August 2022. Higher interest rates will NOT solve these isolated sources of inflation.
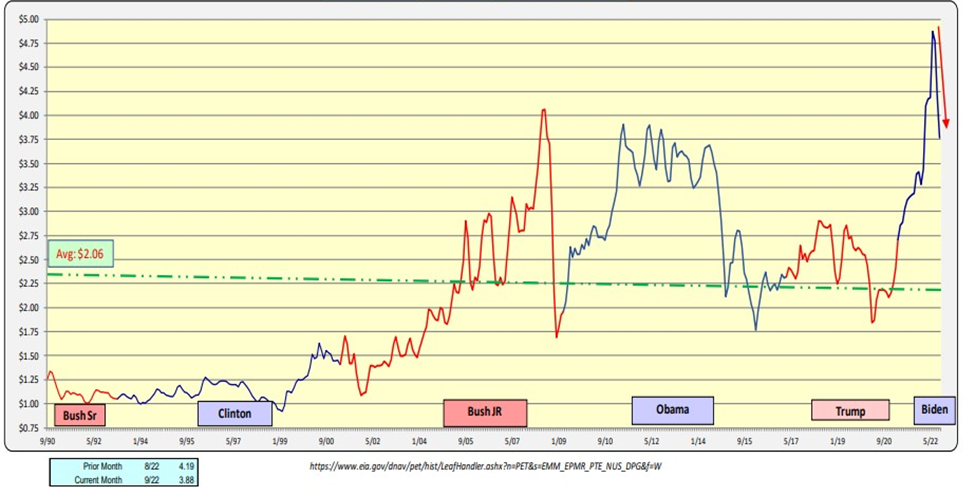
GAS PRICES are an international item that affects all. Putin invades Ukraine 2.24.22 Gas prices were up 19% for the ONE month alone: March 2022 The March 2022 spike will continue to be included in the annual CPI calculation for the next 8 months. It is the gift that will keep on giving. For June gas prices are up 17% over May. Gas prices for the month of August were down 7%.
US Dept of Energy: US Average Gas Prices (nominal)
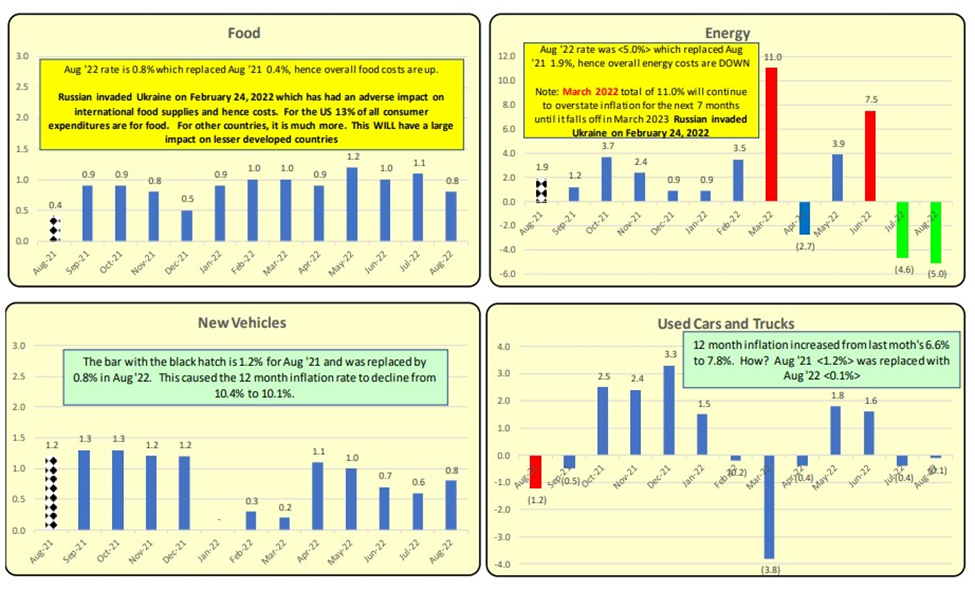
August 2021 data (red) was replaced by August 2022 (green). When red is larger than green, then inflation for that item will improve. When green is larger, then inflation is WORSE.
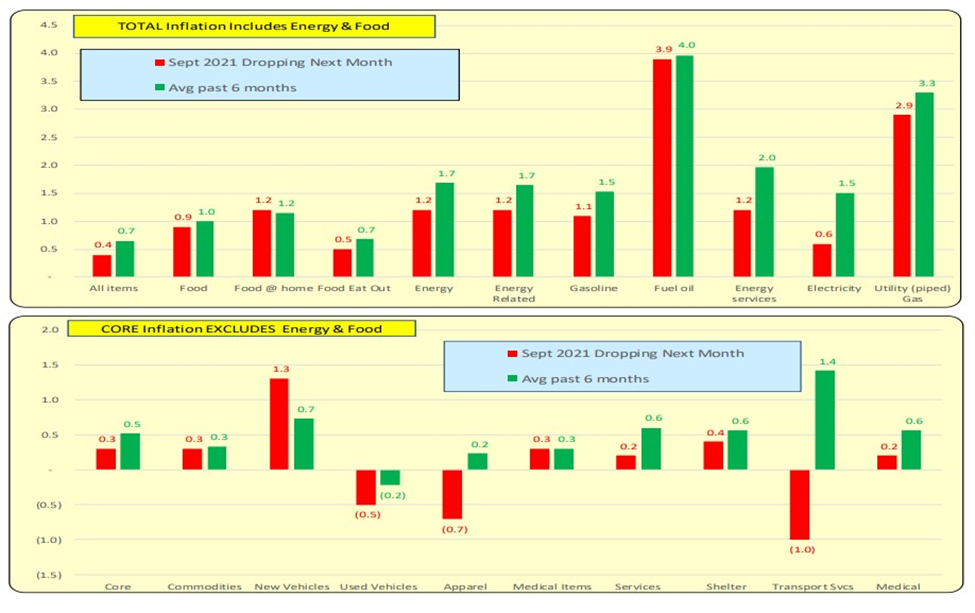
NEXT month will have new data for September 2022, therefore September 2021 data will drop off. September 2021 is the RED bars. The green bar is the average of the prior 6 months (Mar ‘22-Aug ‘22). When green is larger, then inflation is worse. Next month will NOT have good news for the Core component.
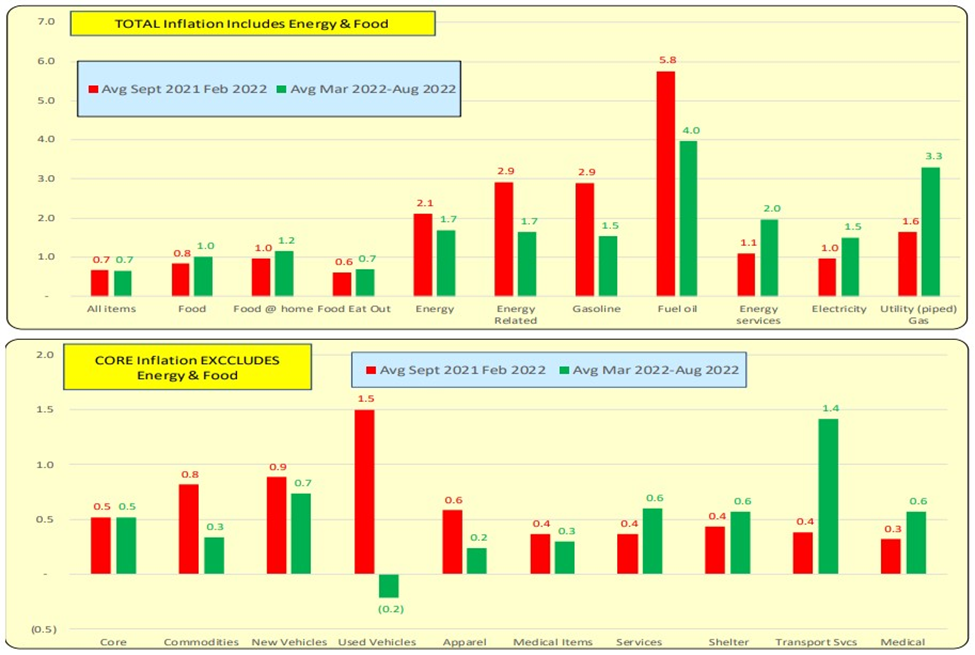
The red bars are the MONTHLY average of September 2021-February 2022 while the green bars are the average of March 2022-August 2022. When green is larger, then inflation is worse. A monthly 0.4% is about a 5.0% annual rate.
Monthly Average of Inflation
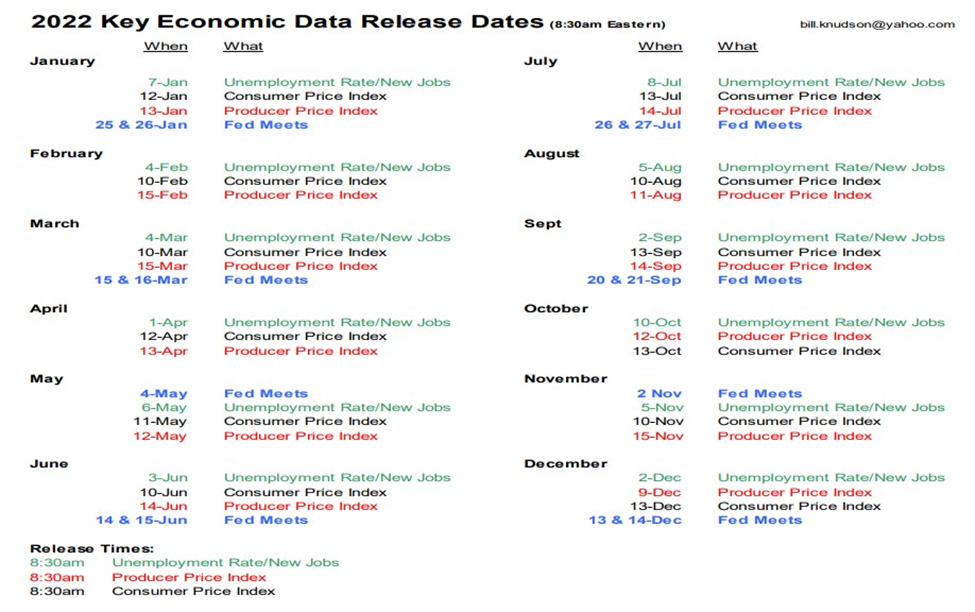
As we move forward in 2022, as the impacts of COVID subside, the economy will come into focus. Below are the publication dates of the CPI, PPI, and Net New Jobs. These items will be key factors during the Federal Reserve’s meetings which are also listed below.
Bill Knudson – Research Analyst for Landco ARESC